

Answered step by step
Verified Expert Solution
Question
1 Approved Answer
My code is: import csv def internet_histogram(): count_6 = 0 count_5 = 0 count_4 = 0 count_3 = 0 count_2 = 0 count_1 = 0
 My code is:
import csv def internet_histogram(): count_6 = 0 count_5 = 0 count_4 = 0 count_3 = 0 count_2 = 0 count_1 = 0 with open("survey.csv",'r') as f: reader = csv.reader(f) with open("histogram.csv", 'w') as g: writer = csv.writer(g) next(reader) for line in reader: if int(line[3]) >= 28 and int(line[3]) However, i got a error feedback said:
function internet_histogram incorrect on input []
wrote: "1,26 2,29 3,2 4,3 5,1 6,1 " expected: "1,181 2,229 3,17 4,23 5,5 6,12 "
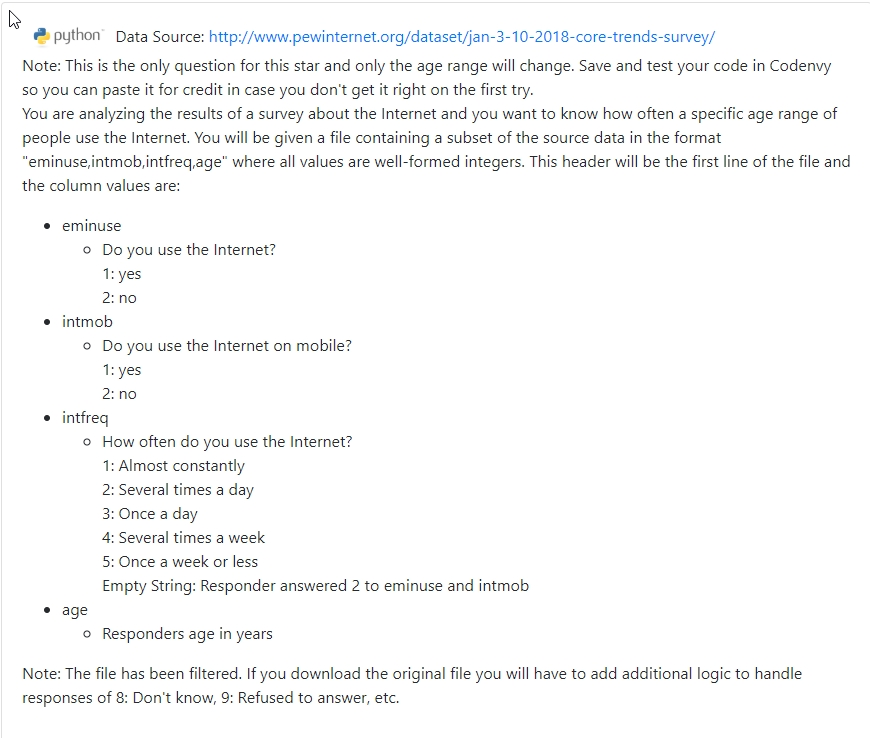
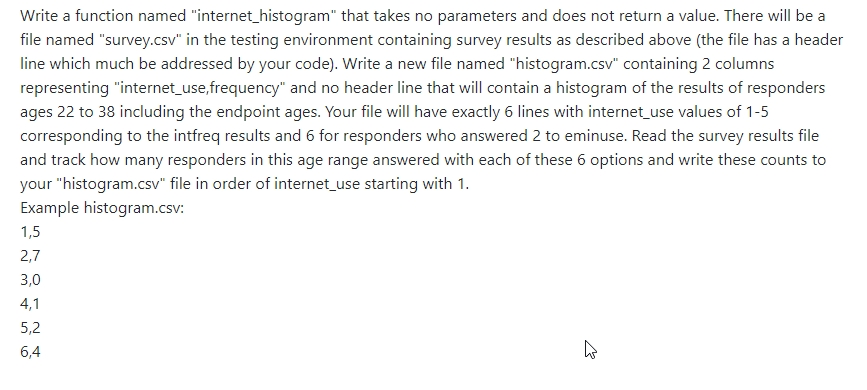
python Data Source: http://www.pewinternet.org/dataset/jan-3-10-2018-core-trends-survey Note: This is the only question for this star and only the age range will change. Save and test your code in Codenvy so you can paste it for credit in case you don't get it right on the first try You are analyzing the results of a survey about the Internet and you want to know how often a specific age range of people use the Internet. You will be given a file containing a subset of the source data in the format "eminuse,intmob,intfreq,age" where all values are well-formed integers. This header will be the first line of the file and the column values are: eminuse o Do you use the Internet? 1: yes 2: no intmob o Do you use the Internet on mobile? 1: yes 2: no intfrea o How often do you use the Internet? 1: Almost constantly 2: Several times a day 3: Once a day 4: Several times a week 5: Once a week or less Empty String: Responder answered 2 to eminuse and intmob o Responders age in years Note: The file has been filtered. If you download the original file you will have to add additional logic to handle responses of 8: Don't know, 9: Refused to answer, etc. Write a function named "internet histogram" that takes no parameters and does not return a value. There will be a file named "survey.csv" in the testing environment containing survey results as described above (the file has a header lw representing "internet_use,frequency" and no header line that will contain a histogram of the results of responders liu corresponding to the intfreq results and 6 for responders who answered 2 to eminuse. Read the survey results file and track how many responders in this age range answered with each of these 6 options and write these counts to your "histogram.csv" file in order of internet use starting with 1 Example histogram.csv 1,5 2,7 3,0 4,1 5,2 6,4 python Data Source: http://www.pewinternet.org/dataset/jan-3-10-2018-core-trends-survey Note: This is the only question for this star and only the age range will change. Save and test your code in Codenvy so you can paste it for credit in case you don't get it right on the first try You are analyzing the results of a survey about the Internet and you want to know how often a specific age range of people use the Internet. You will be given a file containing a subset of the source data in the format "eminuse,intmob,intfreq,age" where all values are well-formed integers. This header will be the first line of the file and the column values are: eminuse o Do you use the Internet? 1: yes 2: no intmob o Do you use the Internet on mobile? 1: yes 2: no intfrea o How often do you use the Internet? 1: Almost constantly 2: Several times a day 3: Once a day 4: Several times a week 5: Once a week or less Empty String: Responder answered 2 to eminuse and intmob o Responders age in years Note: The file has been filtered. If you download the original file you will have to add additional logic to handle responses of 8: Don't know, 9: Refused to answer, etc. Write a function named "internet histogram" that takes no parameters and does not return a value. There will be a file named "survey.csv" in the testing environment containing survey results as described above (the file has a header lw representing "internet_use,frequency" and no header line that will contain a histogram of the results of responders liu corresponding to the intfreq results and 6 for responders who answered 2 to eminuse. Read the survey results file and track how many responders in this age range answered with each of these 6 options and write these counts to your "histogram.csv" file in order of internet use starting with 1 Example histogram.csv 1,5 2,7 3,0 4,1 5,2 6,4 Step by Step Solution
There are 3 Steps involved in it
Step: 1

Get Instant Access to Expert-Tailored Solutions
See step-by-step solutions with expert insights and AI powered tools for academic success
Step: 2

Step: 3
Ace Your Homework with AI
Get the answers you need in no time with our AI-driven, step-by-step assistance
Get Started
Database Administrator Limited Edition
Authors: Martif Way
1st Edition
B0CGG89N8Z