

Question
My company is Andrews. My products are Able, A_Bria, & A_Grad. III. Market Segmentation Pay particular attention to the sections on market segmentation, pricing, the
My company is Andrews. My products are Able, A_Bria, & A_Grad.
III. Market Segmentation Pay particular attention to the sections on market segmentation, pricing, the low-tech segment, the high-tech segment, and the contribution margin. i. What is the price of your products? ii. What was your promotional budgets? iii. What was your sales budgets? iv. What was the sales forecast for each product? v. What were the accounts receivable (A/R) and accounts payable (A/P) implications of the decisions?
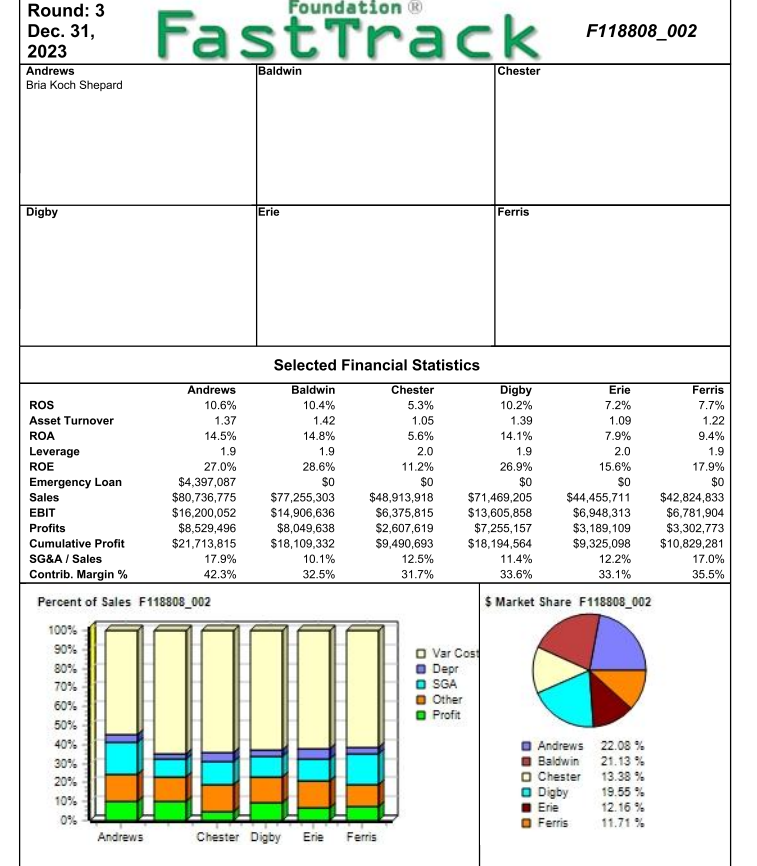
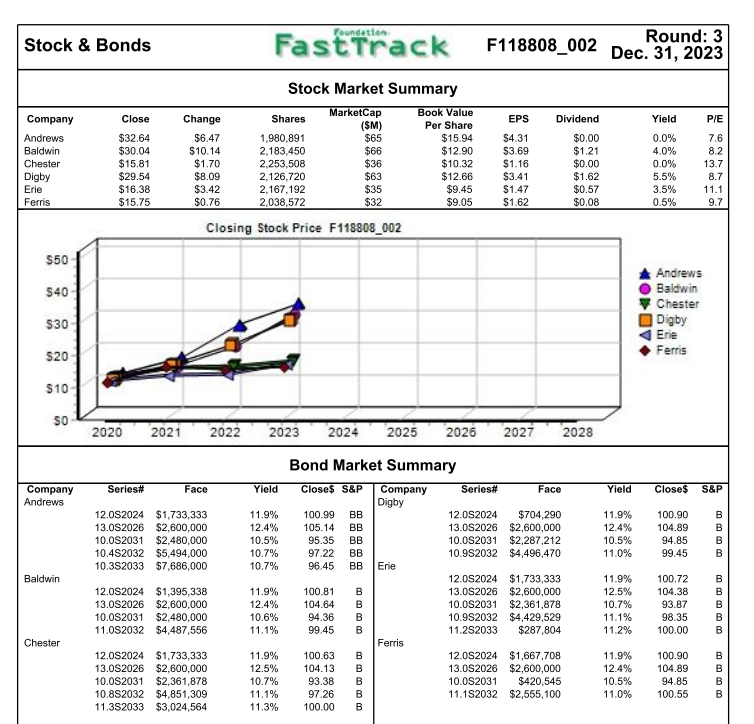
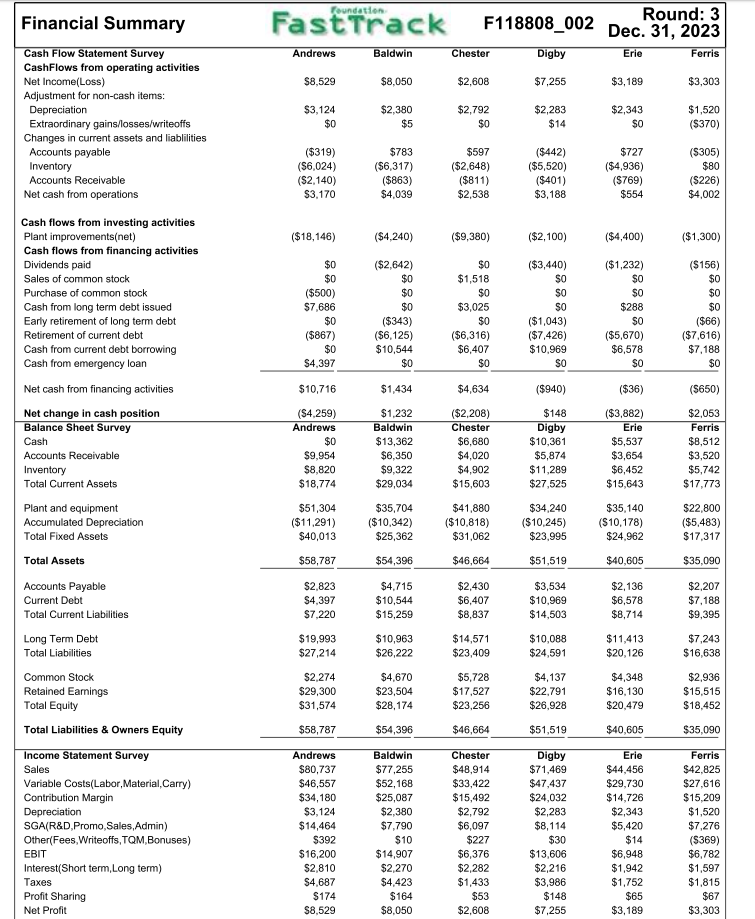
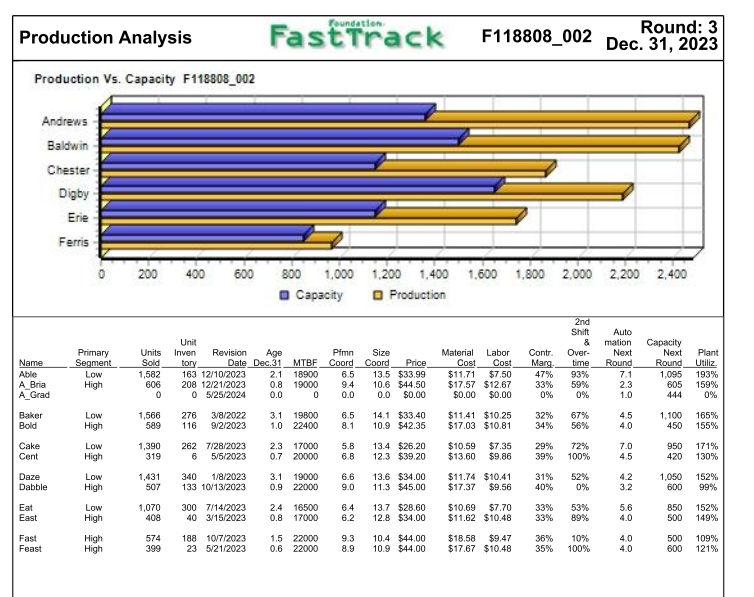
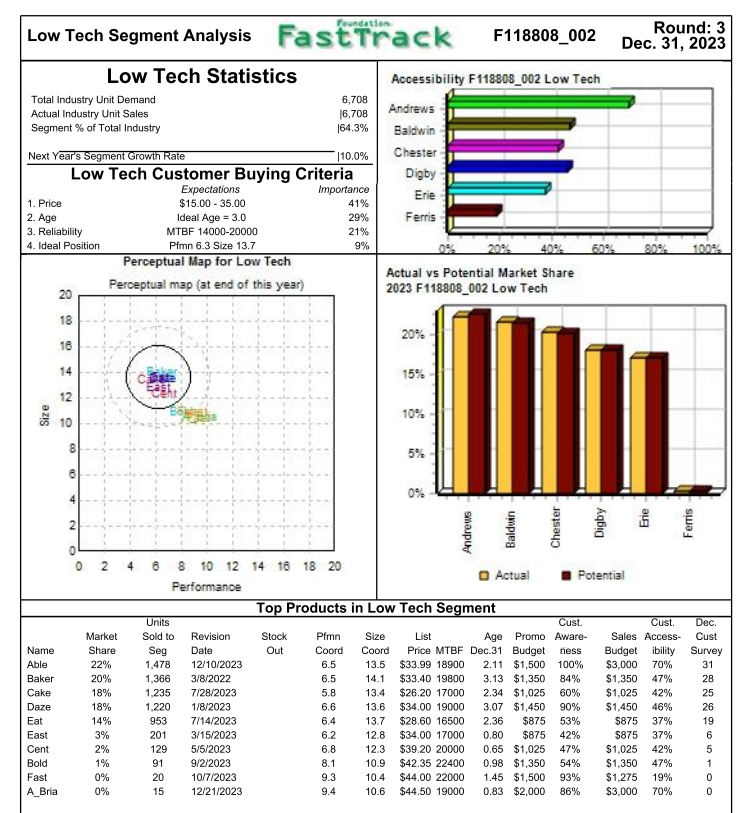
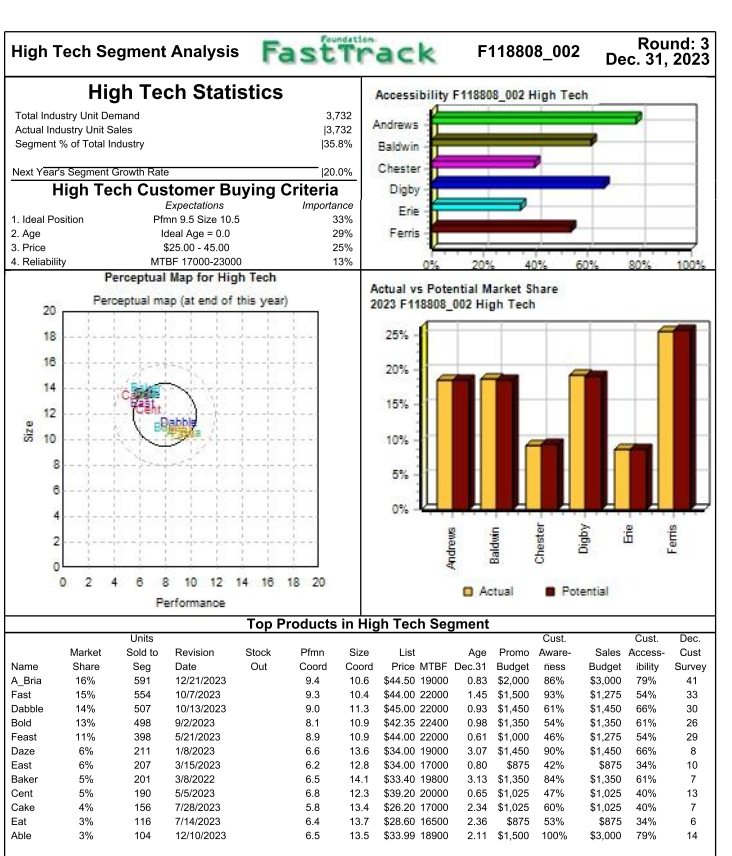
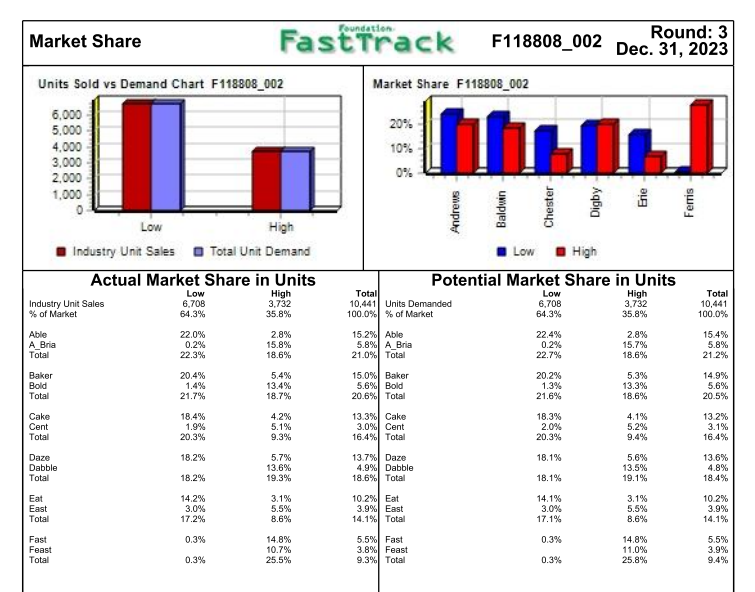
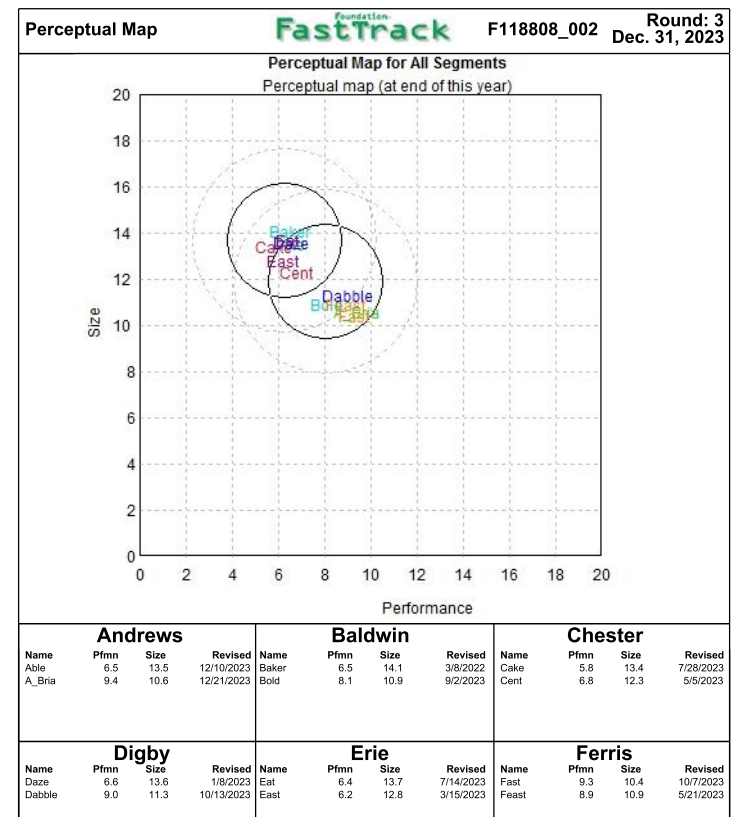
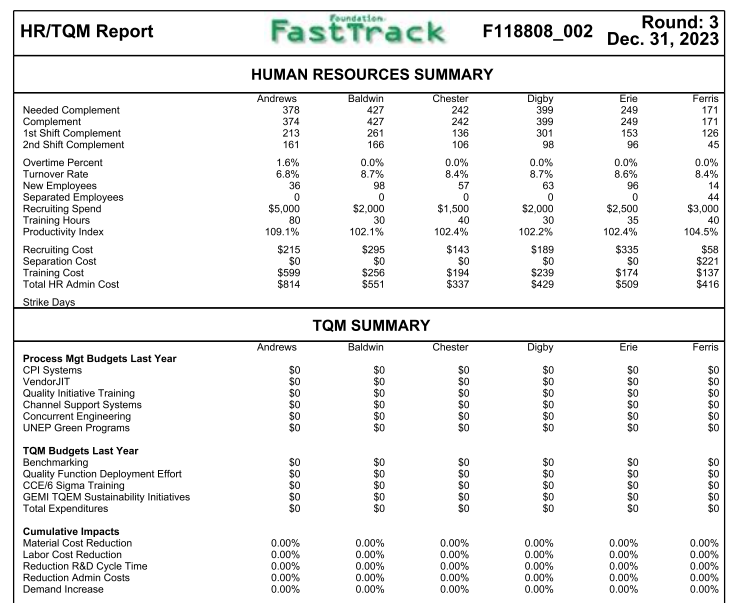
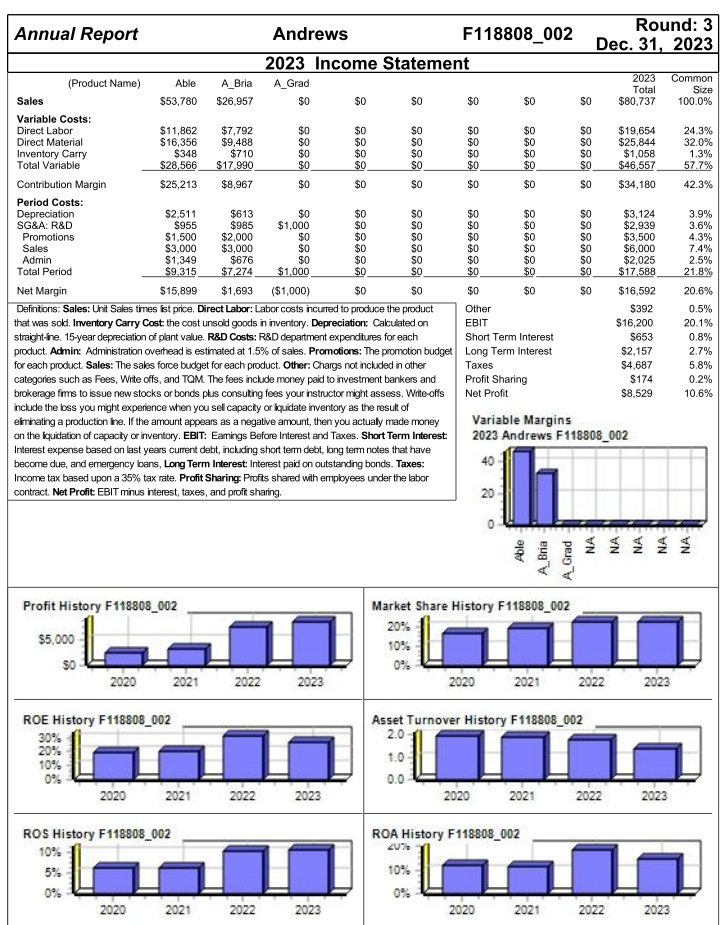
Foundation Round: 3 Dec. 31, 2023 Andrews Bria Koch Shepard FastTrack F118808_002 Baldwin Chester Digby Erie Ferris ROS Asset Turnover ROA Leverage ROE Emergency Loan Sales EBIT Profits Cumulative Profit SG&A / Sales Contrib. Margin % Andrews 10.6% 1.37 14.5% 1.9 27.0% $4,397,087 $80,736,775 $16,200,052 $8,529,496 $21,713,815 17.9% 42.3% Selected Financial Statistics Baldwin Chester Digby 10.4% 5.3% 10.2% 1.42 1.05 1.39 14.8% 5.6% 14.1% 1.9 2.0 1.9 28.6% 11.2% 26.9% SO $0 $0 $77,255,303 $48,913,918 $71,469,205 $14,906,636 $6,375,815 $13,605,858 $8,049,638 $2,607,619 $7,255,157 $18,109,332 $9.490,693 $18,194,564 10.1% 12.5% 11.4% 32.5% 31.7% 33.6% Erie 7.2% 1.09 7.9% 2.0 15.6% SO $44,455,711 $6,948,313 $3,189,109 $9,325,098 12.2% 33.1% Ferris 7.7% 1.22 9.4% 1.9 17.9% $0 $42,824,833 $6,781,904 $3,302,773 $10,829,281 17.0% 35.5% Percent of Sales F118808_002 $ Market Share F118808_002 100% 90% 80% 70% M Var Cost Depr O SGA Other Profit 60% 50% 40% 30% 20% 10% 0% Andrews 22.08 % Baldwin 21.13% Chester 13.38% Digby 19.55% Erie 12.16 % Ferris 11.71 % Andrews Chester Digby Erie Ferris foundation Stock & Bonds FastTrack F118808_002 Round: 3 Dec. 31, 2023 Stock Market Summary Company Shares EPS Dividend Yield PIE Andrews Baldwin Chester Digby Erie Ferris Close $32.64 $30.04 $15.81 $29.54 $16.38 $15.75 Change $6.47 $10.14 $1.70 $8.09 $3.42 $0.76 1,980,891 2,183,450 2,253,508 2,126,720 2.167.192 2,038,572 MarketCap (SM) $65 $66 $36 $63 $35 $32 Book Value Per Share $15.94 $12.90 $10.32 $12.66 $9.45 $9.05 $4.31 $3.69 $1.16 $3.41 $1.47 $1.62 $0.00 $1.21 $0.00 $1.62 $0.57 $0.08 0.0% 4.0% 0.0% 5.5% 3.5% 0.5% 7.6 8.2 13.7 8.7 11.1 9.7 Closing Stock Price F118808_002 $50 540 ADIO Andrews Baldwin Chester Digby Erie Ferris $30 $20 S10 SO 2020 2021 2022 2023 2024 2025 2026 2027 2028 Bond Market Summary Series# Face Yield Close$ S&P Series# Face Yield Close$ S&P Company Andrews Company Digby 12.082024 $1,733,333 13.0S2026 $2,600,000 10.082031 $2,480,000 10.452032 $5,494,000 10.352033 $7,686,000 11.9% 12.4% 10.5% 10.7% 10.7% 100.99 105.14 95.35 97.22 96.45 BB BB BB BB BB 12.0S2024 $704,290 13.0S2026 $2,600,000 10.082031 $2,287,212 10.9S2032 $4,496,470 11.9% 12.4% 10.5% 11.0% 100.90 104.89 94.85 99.45 B B B B Erie Baldwin 12.082024 $1,395,338 13.082026 $2,600,000 10.082031 $2,480,000 11.082032 $4,487,556 11.9% 12.4% 10.6% 11.1% 100.81 104.64 94.36 99.45 B B B 12.0S2024 $1,733,333 13.0S2026 $2,600,000 10.082031 $2,361,878 10.992032 $4,429,529 11.2S2033 $287,804 11.9% 12.5% 10.7% 11.1% 11.2% 100.72 104.38 93.87 98.35 100.00 B B B B B Chester Ferris 12.0S2024 $1,733,333 13.0S2026 $2,600,000 10.082031 $2,361,878 10.882032 $4,851,309 11.352033 $3,024,564 11.9% 12.5% 10.7% 11.1% 11.3% 100.63 104.13 93.38 97.26 100.00 B B B B 12.0S2024 $1,667,708 13.0S2026 $2,600,000 10.082031 $420,545 11.152032 $2,555,100 11.9% 12.4% 10.5% 11.0% 100.90 104.89 94.85 100.55 B B B B Foundation Financial Summary Fast Track Round: 3 F118808_002 Dec 31, 2023 Andrews Baldwin Chester Digby Erie Ferris $8,529 $8,050 $2,608 $7,255 $3,189 $3,303 Cash Flow Statement Survey CashFlows from operating activities Net Income(Loss) Adjustment for non-cash items: Depreciation Extraordinary gains/losses/writeoffs Changes in current assets and liablilities Accounts payable Inventory Accounts Receivable Net cash from operations $3,124 $0 $2,380 $5 $2,792 $0 $2,283 $14 $2,343 $0 $1,520 ($370) ($319) ($6,024) ($2,140) $3,170 $783 ($6,317) ($863) $4,039 $597 ($2,648) ($811) $2,538 ($442) ($5,520) ($401) $3,188 $727 ($4,936) (5769) $554 ($305) $80 (S226) $4,002 ($18,146) ($4,240) ($9,380) ($2,100) ($4,400) ($1,300) $0 $0 ($500) $7,686 $0 ($867) $0 $4.397 ($2,642) $0 $0 $0 ($343) ($6,125) $10,544 $0 $0 $1,518 $0 $3,025 $0 ($6,316) $6,407 $0 ($3,440) $0 SO SO ($1,043) ($7,426) $10.969 SO ($1,232) $0 $0 $288 SO ($5,670) $6,578 SO ($156) $0 $0 $0 ($66) ($7,616) $7,188 $0 Cash flows from investing activities Plant improvements(net) Cash flows from financing activities Dividends paid Sales of common stock Purchase of common stock Cash from long term debt issued Early retirement of long term debt Retirement of current debt Cash from current debt borrowing Cash from emergency loan Net cash from financing activities Net change in cash position Balance Sheet Survey Cash Accounts Receivable Inventory Total Current Assets Plant and equipment Accumulated Depreciation Total Fixed Assets Total Assets $10,716 $1,434 $4,634 ($940) ($36) ($650) ($4,259) Andrews $0 $9.954 $8,820 $18,774 $1,232 Baldwin $13,362 $6,350 $9,322 $29,034 ($2,208) Chester $6,680 $4,020 $4,902 $15,603 $148 Digby $10,361 $5,874 $11,289 $27,525 ($3,882) Erie $5,537 $3,654 $6,452 $15,643 $2,053 Ferris $8,512 $3,520 $5,742 $17,773 $51,304 ($11.291) $40,013 $35,704 ($10,342) $25,362 $41,880 ($10,818) $31,062 $34,240 ($10.245) $23,995 $35,140 ($10,178) $24.962 $22,800 ($5,483) $17,317 $58,787 $54,396 $46,664 $51,519 $40,605 $35,090 Accounts Payable Current Debt Total Current Liabilities $2,823 $4,397 $7.220 $4,715 $10,544 $15,259 $2,430 $6,407 $8,837 $3,534 $10.969 $14,503 $2,136 $6,578 $8,714 $2,207 $7,188 $9,395 Long Term Debt Total Liabilities $19,993 $27,214 $10,963 $26,222 $14,571 $23,409 $10,088 $24,591 $11,413 $20,126 $7,243 $16,638 $2,274 $29,300 $31,574 $4,670 $23,504 $28,174 $5,728 $17.527 $23,256 $4,137 $22.791 $26.928 $4,348 $16,130 $20,479 $2,936 $15,515 $18.452 $58,787 $54,396 $46,664 $51,519 $40,605 $35,090 Common Stock Retained Earnings Total Equity Total Liabilities & Owners Equity Income Statement Survey Sales Variable Costs(Labor, Material Carry) Contribution Margin Depreciation SGA(R&D, Promo, Sales, Admin) Other(Fees, Writeoffs, TQM,Bonuses) EBIT Interest(Short term, Long term) Taxes Profit Sharing Net Profit Andrews $80,737 $46,557 $34,180 $3,124 $14,464 $392 $16,200 $2,810 $4,687 $174 $8.529 Baldwin $77.255 $52,168 $25,087 $2,380 $7,790 $10 $14,907 $2,270 $4,423 $164 $8,050 Chester $48,914 $33,422 $15,492 $2,792 $6,097 $227 $6,376 $2,282 $1,433 $53 $2,608 Digby $71,469 $47,437 $24,032 $2,283 $8,114 $30 $13,606 $2,216 $3,986 $148 $7,255 Erie $44,456 $29,730 $14,726 $2,343 $5,420 $14 $6,948 $1,942 $1,752 $65 $3,189 Ferris $42,825 $27,616 $15,209 $1,520 $7,276 ($369) $6,782 $1,597 $1,815 $67 $3,303 Foundation Production Analysis Fast Track F118808_002 Round: 3 Dec. 31, 2023 Production Vs. Capacity F118808_002 Andrews Baldwin Chester Digby Erie Ferris 0 200 400 600 1.600 1,800 2.000 2,200 2.400 800 1,000 1,200 1,400 Capacity Production Plant Name Able A Bria A Grad Primary Segment Low High Units Sold 1,582 606 0 Unit Inven Revision Age Pfmn Size tory Date Dec.31 MTBF Coord Coord Price 163 12/10/2023 2.1 18900 6.5 13.5 $33.99 208 12/21/2023 0.8 19000 9.4 10.6 $44.50 05/25/2024 0.0 0 0.0 0.0 $0.00 Material Labor Cost Cost $11.71 $7.50 $17.57 $12.67 $0.00 $0.00 Contr. Marg. 47% 33% 0% 2nd Shift & Over- time 93% 59% 0% Auto mation Next Round 7.1 2.3 1.0 Capacity Next Round 1,095 605 444 193% 159% 0% 6.5 165% Baker Bold Low High 1,566 589 276 116 3/8/2022 9/2/2023 3.1 19800 1.0 22400 14.1 $33.40 10.9 $42.35 $11.41 $10.25 $17.03 $10.81 32% 34% 8.1 67% 56% 4.5 4.0 1,100 450 155% 950 Cake Cent Low High 1,390 319 262 7/28/2023 6 5/5/2023 2.3 17000 0.7 20000 5.8 6.8 13.4 $26.20 12.3 $39.20 $10.59 $13.60 $7.35 $9.86 29% 39% 72% 100% 7.0 45 171% 130% 420 Daze Dabble 340 1/8/2023 133 10/13/2023 1,431 507 3.1 19000 0.9 22000 6.6 52% 13.6 $34.00 11.3 $45.00 31% 40% $11.74 $10.41 $17.37 $9.56 9.0 1,050 600 4.2 3.2 152% 99% 0% Low High Low High Eat East 1,070 408 300 7/14/2023 40 3/15/2023 2.4 16500 0.8 17000 6.4 6.2 13.7 $28.60 12.8 $34.00 $10.69 $7.70 $11.62 $10.48 33% 33% 53% 89% 5.6 4.0 850 500 152% 149% Fast 574 9.3 Feast High High 399 188 10/7/2023 23 5/21/2023 1,5 22000 0.6 22000 8.9 10.4 $44.00 10.9 $44.00 $18.58 $9.47 $17.67 $10.48 36% 35% 10% 100% 4.0 4.0 500 600 109% 121% Round: 3 Dec. 31, 2023 Foundation Low Tech Segment Analysis Fast Track F118808_002 Low Tech Statistics Accessibility F118808_002 Low Tech Total Industry Unit Demand 6,708 Actual Industry Unit Sales 16,708 Andrews Segment % of Total Industry 164.3% Baldwin Next Year's Segment Growth Rate 10.0% Chester Low Tech Customer Buying Criteria Digby Expectations Importance Erie 1. Price $15.00 - 35.00 2. Age Ideal Age = 3.0 Ferris Reliability MTBF 14000-20000 4. Ideal Position Pfmn 6.3 Size 13.7 Perceptual Map for Low Tech Actual vs Potential Market Share Perceptual map (at end of this year) 20 2023 F118808_002 Low Tech 41% 29% 21% 9% 18 20% 16 14 t 15% 12 Size 10% 10 8 5% 6 0% 0 0 4 N Name Able Baker Cake Daze Eat East Cent Bold Fast A_Bria Market Share 22% 20% 18% 18% 14% 3% 2% 1% 0% 0% 8 8 10 12 14 16 18 20 Actual Potential Performance Top Products in Low Tech Segment Units Cust. Cust. Sold to Revision Stock Pimn Size List Age Promo Aware Sales Access- Seg Date Out Coord Coord Price MTBF Dec.31 Budget ness Budgetibility 1,478 12/10/2023 6.5 13.5 $33.99 18900 2.11 $1,500 100% $3.000 70% 1,366 3/8/2022 6.5 14.1 $33.40 19800 3.13 $1,350 84% $1,350 47% 1,235 7/28/2023 5.8 13.4 $26.20 17000 2.34 $1,025 60% $1,025 42% 1,220 1/8/2023 6.6 13.6 $34.00 19000 3.07 $1,450 90% $1,450 46% 953 7/14/2023 6.4 13.7 $28.60 16500 2.36 $875 53% $875 37% 201 3/15/2023 6.2 12.8 $34.00 17000 0.80 $875 42% $875 37% 129 5/5/2023 6.8 12.3 $39.20 20000 0.65 $1,025 47% $1,025 42% 91 9/2/2023 8.1 10.9 $42.35 22400 0.98 $1,350 54% $1,350 47% 20 10/7/2023 9.3 10.4 $44.00 22000 1.45 $1,500 93% $1.275 19% 15 12/21/2023 9.4 10.6 $44.50 19000 0.83 $2,000 86% $3,000 70% Dec. Cust Survey 31 28 25 26 19 6 5 1 0 Round: 3 Dec. 31, 2023 foundation High Tech Segment Analysis Fast Track F118808_002 High Tech Statistics Accessibility F118808_002 High Tech Total Industry Unit Demand 3,732 Actual Industry Unit Sales Andrews 13,732 Segment % of Total Industry 135.8% Baldwin Next Year's Segment Growth Rate 120.0% Chester High Tech Customer Buying Criteria Digby Expectations Importance Erie 1. Ideal Position Pfmn 9.5 Size 10.5 33% 2. Age Ideal Age = 0.0 29% Ferris 3. Price $25.00 - 45.00 25% 4. Reliability MTBF 17000-23000 13% 20% 60% Perceptual Map for High Tech Actual vs Potential Market Share Perceptual map (at end of this year) 20 2023 F118808_002 High Tech 18 25% 16 14 20% 15% 12 Size ILL. 10 10% 8 5% 6 0% 2 Andrews Baldwin Chester 0 0 4 Name A_Bria Fast Dabble Bold Feast Daze East Baker Cent Cake Eat Able Market Share 16% 15% 14% 13% 11% 6% 6% 5% 5% 4% 3% 3% 6 8 10 12 14 16 18 20 Actual Potential Performance Top Products in High Tech Segment Units Cust Cust. Sold to Revision Stock Pimn Size List Age Promo Aware Sales Access- Seg Date Out Coord Coord Price MTBF Dec.31 Budget ness Budgetibility 591 12/21/2023 9.4 10.6 $44.50 19000 0.83 $2,000 86% $3,000 79% 554 10/7/2023 9.3 10.4 $44.00 22000 1.45 $1,500 93% $1,275 54% 507 10/13/2023 9.0 11.3 $45.00 22000 0.93 $1,450 61% $1,450 66% 498 9/2/2023 8.1 10.9 $42.35 22400 0.98 $1,350 54% $1,350 61% 398 5/21/2023 8.9 10.9 $44.00 22000 0.61 $1,000 46% $1,275 54% 211 1/8/2023 6.6 13.6 $34.00 19000 3.07 $1,450 90% $1,450 66% 207 3/15/2023 6.2 12.8 $34.00 17000 0.80 $875 42% $875 34% 201 3/8/2022 6.5 14.1 $33.40 19800 3.13 $1,350 84% $1,350 61% 190 5/5/2023 6.8 12.3 $39.20 20000 0.65 $1,025 47% $1,025 40% 156 7/28/2023 5.8 13.4 $26.20 17000 2.34 $1,025 60% $1,025 40% 116 7/14/2023 6.4 13.7 $28.60 16500 2.36 $875 53% $875 104 12/10/2023 6.5 13.5 $33.99 18900 2.11 $1,500 100% $3,000 79% Dec. Cust Survey 41 33 30 26 29 8 10 7 13 7 6 34% 14 foundation Market Share Fast Track Round: 3 F118808_002 Dec 31, 2023 Units Sold vs Demand Chart F118808_002 Market Share F118808_002 20% 10% 6,000 5.000 4,000 3,000 2.000 1,000 0 Low High Industry Unit Sales Total Unit Demand Actual Market Share in Units Low High Industry Unit Sales 6.708 3,732 % of Market 64.3% 35.8% Total Low High Potential Market Share in Units Total Low High 10,441 Units Demanded 6,708 3,732 100.0% % of Market 64.3% 35.8% 15.2% Able 22.4% 2.8% 5.8%A_Bria 0.2% 15.7% 21.0% Total 22.7% 18.6% 10,441 100.0% Able A_Bria Total 22.0% 0.2% 22.3% 2.8% 15.8% 18.6% 15.4% 5.8% 21.2% Baker Bold Total 20.4% 1.4% 21.7% 5.4% 13.4% 18.7% 15.0% Baker 5.6% Bold 20.6% Total 20.2% 1.3% 21.6% 5.3% 13.3% 18.6% 14.9% 5.6% 20.5% Cake Cent Total 18.4% 1.9% 20.3% 4.2% 5.1% 9.3% 13.3% Cake 3.0% Cent 16.4% Total 18.3% 2.0% 20.3% 4.1% 5.2% 9.4% 13.2% 3.1% 16.4% 18.2% 18.1% Daze Dabble Total 5.7% 13.6% 19.3% 13.7% Daze 4.9% Dabble 18.6% Total 5.6% 13.5% 19.1% 13.6% 4.8% 18.4% 18.2% 18.1% 3.1% Eat East 14.2% 3.0% 17.2% 3.1% 5.5% 8.6% 10.2% Eat 3.9% East 14.1% Total 14.1% 3.0% 17.1% 5.5% 10.2% 3.9% 14.1% Total 8.6% 0.3% 0.3% Fast Feast Total 14.8% 10.7% 25.5% 5.5% Fast 3.8% Feast 9.3% Total 14.8% 11.0% 25.8% 5.5% 3.9% 9.4% 0.3% 0.3% Foundation Perceptual Map Round: 3 Fast Track F118808_002 Dec. 31, 2023 Perceptual Map for All Segments Perceptual map (at end of this year) 20 18 16 14 Dale Capate Fast Cent 12 Dabble BH AZIS 10 8 6 4 N 0 0 4 6 16 18 20 N 8 10 12 14 Performance Baldwin Andrews Chester Name Able A_Bria Pfmn 6.5 9.4 Size 13.5 10.6 Revised Name 12/10/2023 Baker 12/21/2023 Bold Pfmn 6.5 8.1 Size 14.1 10.9 Revised 3/8/2022 9/2/2023 Name Cake Cent Pfmn 5.8 6.8 Size 13.4 12.3 Revised 7/28/2023 5/5/2023 Digby Erie Ferris Name Daze Dabble Pfmn 6.6 9.0 Size 13.6 11.3 Revised Name 1/8/2023 Eat 10/13/2023 East Pfmn 6.4 6.2 Size 13.7 12.8 Revised 7/14/2023 3/15/2023 Name Fast Feast Pfmn 9.3 8.9 Size 10.4 10.9 Revised 10/7/2023 5/21/2023 8. Foundation HR/TQM Report Fast Track Round: 3 F118808_002 Dec. 31, 2023 HUMAN RESOURCES SUMMARY Andrews 378 374 Chester 242 242 136 106 Digby 399 399 301 98 Ferris 171 171 126 45 213 Needed Complement Complement 1st Shift Complement 2nd Shift Complement Overtime Percent Turnover Rate New Employees Separated Employees Recruiting Spend Training Hours Productivity Index Recruiting Cost Separation Cost Training Cost Total HR Admin Cost Strike Days 161 1.6% 6.8% 36 0 $5,000 80 109.1% $215 $0 $599 $814 Baldwin 427 427 261 166 0.0% 8.7% 98 0 $2,000 30 102.1% $295 $0 $256 $551 0.0% 8.4% 57 0 $1,500 40 102.4% $143 SO $194 $337 0.0% 8.7% 63 0 $2,000 30 102.2% $189 $0 $239 $429 Erie 249 249 153 96 0.0% 8.6% 96 0 $2,500 35 102.4% $335 SO $174 $509 0.0% 8.4% 14 44 $3,000 40 104.5% $58 $221 $137 $416 TQM SUMMARY Andrews Baldwin Chester Digby Erie Ferris Process Mgt Budgets Last Year CPI Systems VendorJIT Quality Initiative Training Channel Support Systems Concurrent Engineering UNEP Green Programs SO $0 $0 $0 $0 $0 $0 $0 $0 SO SO SO SO SO $0 $0 $0 $0 $0 $0 $0 SO $0 SO $0 SO $0 $0 $0 $0 $0 $0 $0 $O $0 $0 $0 $0 $0 $0 $0 SO $0 SO SO SO $0 $0 $0 $0 $0 SO SO SO $0 SO $0 $0 $0 $0 $0 SO TQM Budgets Last Year Benchmarking Quality Function Deployment Effort CCE/6 Sigma Training GEMI TQEM Sustainability Initiatives Total Expenditures Cumulative Impacts Material Cost Reduction Labor Cost Reduction Reduction R&D Cycle Time Reduction Admin Costs Demand Increase 0.00% 0.00% 0.00% 0.00% 0.00% 0.00% 0.00% 0.00% 0.00% 0.00% 0.00% 0.00% 0.00% 0.00% 0.00% 0.00% 0.00% 0.00% 0.00% 0.00% 0.00% 0.00% 0.00% 0.00% 0.00% 0.00% 0.00% 0.00% 0.00% 0.00% $0 Annual Report Andrews Round: 3 F118808_002 Dec. 31, 2023 2023 Income Statement (Product Name) Able Common A_Bria 2023 A_Grad Total Size Sales $53,780 $26.957 $0 SO $0 $0 SO $80,737 100.0% Variable Costs: Direct Labor $11,862 $7,792 $0 $0 $0 $0 $0 $0 $19,654 24.3% Direct Material $16,356 $9,488 SO $0 SO $0 $0 SO $25,844 32.0% Inventory Carry $348 $710 $0 $0 $0 $0 $0 $0 $1,058 1.3% Total Variable $28,566 $17.990 $0 $0 SO $0 $0 SO $46,557 57.7% Contribution Margin $25,213 $8,967 $0 $0 SO $0 $0 SO $34,180 42.3% Period Costs: Depreciation $2,511 $613 $0 $0 SO $0 $0 SO $3,124 3.9% SG&A: R&D $955 $985 $1,000 $0 SO $0 $0 $0 $2,939 3.6% Promotions $1,500 $2,000 $0 $0 SO $0 $0 SO $3,500 4.3% Sales $3,000 $3,000 $0 $0 SO $0 $0 $0 $6,000 7.4% Admin $1,349 $676 $0 $0 SO $0 $0 SO $2,025 2.5% Total Period $9,315 $7,274 $1.000 $0 SO $0 $0 SO $17,588 21.8% Net Margin $15,899 $1,693 ($1,000) $0 SO $0 $0 $0 $16,592 20.6% Defintions: Sales: Unit Sales times ist price. Direct Labor: Labor costs incurred to produce the product Other $392 0.5% that was sold. Inventory Carry Cost the cost unsold goods in inventory, Depreciation Calculated on EBIT $16,200 20.1% straight-ine. 15-year depreciation of plant value. R&D Costs: R&D department expenditures for each Short Term Interest $653 0.8% product. Admin Administration overhead is estimated at 1.5% of sales. Promotions: The promotion budget Long Term Interest $2,157 2.7% for each product Sales: The sales force budget for each product. Other: Chargs not included in other Taxes $4.687 5.8% categories such as Fees, Write offs, and TQM. The fees include money paid to investment bankers and Profit Sharing $174 0.2% brokerage fims to issue new stocks or bonds plus consulting fees your instructor might assess. Write-offs Net Profit $8.529 10.6% include the loss you might experience when you sel capacity or liquidate inventory as the result of eliminating a production line. If the amount appears as a negative amount, then you actualy made money Variable Margins on the iquidation of capacy or inventory. EBIT: Eamings Before Interest and Taxes. Short Term Interest: 2023 Andrews F118808_002 Interest expense based on last years current debt, including short term debt, long term notes that have become due, and emergency loans, Long Term Interest: Interest paid on outstanding bonds. Taxes: Income tax based upon a 35% tax rate. Profit Sharing Profts shared with employees under the labor contract. Net Profit EBIT minus interest, taxes, and profit sharing. 40 20 Able A_Bria A Grad Profit History F118808_002 Market Share History F118808_002 20% 10% $5,000 50 2020 2021 2022 2023 2020 2021 2022 2023 ROE History F118808_002 30% 20% 10% 2020 2021 Asset Turnover History F118808_002 2.0 1.0 0.0 2020 2021 2022 2022 2023 2023 ROA History F118808_002 20% ROS History F118808_002 10% 5%. 10% 2020 2021 2022 2023 2021 2023 Foundation Round: 3 Dec. 31, 2023 Andrews Bria Koch Shepard FastTrack F118808_002 Baldwin Chester Digby Erie Ferris ROS Asset Turnover ROA Leverage ROE Emergency Loan Sales EBIT Profits Cumulative Profit SG&A / Sales Contrib. Margin % Andrews 10.6% 1.37 14.5% 1.9 27.0% $4,397,087 $80,736,775 $16,200,052 $8,529,496 $21,713,815 17.9% 42.3% Selected Financial Statistics Baldwin Chester Digby 10.4% 5.3% 10.2% 1.42 1.05 1.39 14.8% 5.6% 14.1% 1.9 2.0 1.9 28.6% 11.2% 26.9% SO $0 $0 $77,255,303 $48,913,918 $71,469,205 $14,906,636 $6,375,815 $13,605,858 $8,049,638 $2,607,619 $7,255,157 $18,109,332 $9.490,693 $18,194,564 10.1% 12.5% 11.4% 32.5% 31.7% 33.6% Erie 7.2% 1.09 7.9% 2.0 15.6% SO $44,455,711 $6,948,313 $3,189,109 $9,325,098 12.2% 33.1% Ferris 7.7% 1.22 9.4% 1.9 17.9% $0 $42,824,833 $6,781,904 $3,302,773 $10,829,281 17.0% 35.5% Percent of Sales F118808_002 $ Market Share F118808_002 100% 90% 80% 70% M Var Cost Depr O SGA Other Profit 60% 50% 40% 30% 20% 10% 0% Andrews 22.08 % Baldwin 21.13% Chester 13.38% Digby 19.55% Erie 12.16 % Ferris 11.71 % Andrews Chester Digby Erie Ferris foundation Stock & Bonds FastTrack F118808_002 Round: 3 Dec. 31, 2023 Stock Market Summary Company Shares EPS Dividend Yield PIE Andrews Baldwin Chester Digby Erie Ferris Close $32.64 $30.04 $15.81 $29.54 $16.38 $15.75 Change $6.47 $10.14 $1.70 $8.09 $3.42 $0.76 1,980,891 2,183,450 2,253,508 2,126,720 2.167.192 2,038,572 MarketCap (SM) $65 $66 $36 $63 $35 $32 Book Value Per Share $15.94 $12.90 $10.32 $12.66 $9.45 $9.05 $4.31 $3.69 $1.16 $3.41 $1.47 $1.62 $0.00 $1.21 $0.00 $1.62 $0.57 $0.08 0.0% 4.0% 0.0% 5.5% 3.5% 0.5% 7.6 8.2 13.7 8.7 11.1 9.7 Closing Stock Price F118808_002 $50 540 ADIO Andrews Baldwin Chester Digby Erie Ferris $30 $20 S10 SO 2020 2021 2022 2023 2024 2025 2026 2027 2028 Bond Market Summary Series# Face Yield Close$ S&P Series# Face Yield Close$ S&P Company Andrews Company Digby 12.082024 $1,733,333 13.0S2026 $2,600,000 10.082031 $2,480,000 10.452032 $5,494,000 10.352033 $7,686,000 11.9% 12.4% 10.5% 10.7% 10.7% 100.99 105.14 95.35 97.22 96.45 BB BB BB BB BB 12.0S2024 $704,290 13.0S2026 $2,600,000 10.082031 $2,287,212 10.9S2032 $4,496,470 11.9% 12.4% 10.5% 11.0% 100.90 104.89 94.85 99.45 B B B B Erie Baldwin 12.082024 $1,395,338 13.082026 $2,600,000 10.082031 $2,480,000 11.082032 $4,487,556 11.9% 12.4% 10.6% 11.1% 100.81 104.64 94.36 99.45 B B B 12.0S2024 $1,733,333 13.0S2026 $2,600,000 10.082031 $2,361,878 10.992032 $4,429,529 11.2S2033 $287,804 11.9% 12.5% 10.7% 11.1% 11.2% 100.72 104.38 93.87 98.35 100.00 B B B B B Chester Ferris 12.0S2024 $1,733,333 13.0S2026 $2,600,000 10.082031 $2,361,878 10.882032 $4,851,309 11.352033 $3,024,564 11.9% 12.5% 10.7% 11.1% 11.3% 100.63 104.13 93.38 97.26 100.00 B B B B 12.0S2024 $1,667,708 13.0S2026 $2,600,000 10.082031 $420,545 11.152032 $2,555,100 11.9% 12.4% 10.5% 11.0% 100.90 104.89 94.85 100.55 B B B B Foundation Financial Summary Fast Track Round: 3 F118808_002 Dec 31, 2023 Andrews Baldwin Chester Digby Erie Ferris $8,529 $8,050 $2,608 $7,255 $3,189 $3,303 Cash Flow Statement Survey CashFlows from operating activities Net Income(Loss) Adjustment for non-cash items: Depreciation Extraordinary gains/losses/writeoffs Changes in current assets and liablilities Accounts payable Inventory Accounts Receivable Net cash from operations $3,124 $0 $2,380 $5 $2,792 $0 $2,283 $14 $2,343 $0 $1,520 ($370) ($319) ($6,024) ($2,140) $3,170 $783 ($6,317) ($863) $4,039 $597 ($2,648) ($811) $2,538 ($442) ($5,520) ($401) $3,188 $727 ($4,936) (5769) $554 ($305) $80 (S226) $4,002 ($18,146) ($4,240) ($9,380) ($2,100) ($4,400) ($1,300) $0 $0 ($500) $7,686 $0 ($867) $0 $4.397 ($2,642) $0 $0 $0 ($343) ($6,125) $10,544 $0 $0 $1,518 $0 $3,025 $0 ($6,316) $6,407 $0 ($3,440) $0 SO SO ($1,043) ($7,426) $10.969 SO ($1,232) $0 $0 $288 SO ($5,670) $6,578 SO ($156) $0 $0 $0 ($66) ($7,616) $7,188 $0 Cash flows from investing activities Plant improvements(net) Cash flows from financing activities Dividends paid Sales of common stock Purchase of common stock Cash from long term debt issued Early retirement of long term debt Retirement of current debt Cash from current debt borrowing Cash from emergency loan Net cash from financing activities Net change in cash position Balance Sheet Survey Cash Accounts Receivable Inventory Total Current Assets Plant and equipment Accumulated Depreciation Total Fixed Assets Total Assets $10,716 $1,434 $4,634 ($940) ($36) ($650) ($4,259) Andrews $0 $9.954 $8,820 $18,774 $1,232 Baldwin $13,362 $6,350 $9,322 $29,034 ($2,208) Chester $6,680 $4,020 $4,902 $15,603 $148 Digby $10,361 $5,874 $11,289 $27,525 ($3,882) Erie $5,537 $3,654 $6,452 $15,643 $2,053 Ferris $8,512 $3,520 $5,742 $17,773 $51,304 ($11.291) $40,013 $35,704 ($10,342) $25,362 $41,880 ($10,818) $31,062 $34,240 ($10.245) $23,995 $35,140 ($10,178) $24.962 $22,800 ($5,483) $17,317 $58,787 $54,396 $46,664 $51,519 $40,605 $35,090 Accounts Payable Current Debt Total Current Liabilities $2,823 $4,397 $7.220 $4,715 $10,544 $15,259 $2,430 $6,407 $8,837 $3,534 $10.969 $14,503 $2,136 $6,578 $8,714 $2,207 $7,188 $9,395 Long Term Debt Total Liabilities $19,993 $27,214 $10,963 $26,222 $14,571 $23,409 $10,088 $24,591 $11,413 $20,126 $7,243 $16,638 $2,274 $29,300 $31,574 $4,670 $23,504 $28,174 $5,728 $17.527 $23,256 $4,137 $22.791 $26.928 $4,348 $16,130 $20,479 $2,936 $15,515 $18.452 $58,787 $54,396 $46,664 $51,519 $40,605 $35,090 Common Stock Retained Earnings Total Equity Total Liabilities & Owners Equity Income Statement Survey Sales Variable Costs(Labor, Material Carry) Contribution Margin Depreciation SGA(R&D, Promo, Sales, Admin) Other(Fees, Writeoffs, TQM,Bonuses) EBIT Interest(Short term, Long term) Taxes Profit Sharing Net Profit Andrews $80,737 $46,557 $34,180 $3,124 $14,464 $392 $16,200 $2,810 $4,687 $174 $8.529 Baldwin $77.255 $52,168 $25,087 $2,380 $7,790 $10 $14,907 $2,270 $4,423 $164 $8,050 Chester $48,914 $33,422 $15,492 $2,792 $6,097 $227 $6,376 $2,282 $1,433 $53 $2,608 Digby $71,469 $47,437 $24,032 $2,283 $8,114 $30 $13,606 $2,216 $3,986 $148 $7,255 Erie $44,456 $29,730 $14,726 $2,343 $5,420 $14 $6,948 $1,942 $1,752 $65 $3,189 Ferris $42,825 $27,616 $15,209 $1,520 $7,276 ($369) $6,782 $1,597 $1,815 $67 $3,303 Foundation Production Analysis Fast Track F118808_002 Round: 3 Dec. 31, 2023 Production Vs. Capacity F118808_002 Andrews Baldwin Chester Digby Erie Ferris 0 200 400 600 1.600 1,800 2.000 2,200 2.400 800 1,000 1,200 1,400 Capacity Production Plant Name Able A Bria A Grad Primary Segment Low High Units Sold 1,582 606 0 Unit Inven Revision Age Pfmn Size tory Date Dec.31 MTBF Coord Coord Price 163 12/10/2023 2.1 18900 6.5 13.5 $33.99 208 12/21/2023 0.8 19000 9.4 10.6 $44.50 05/25/2024 0.0 0 0.0 0.0 $0.00 Material Labor Cost Cost $11.71 $7.50 $17.57 $12.67 $0.00 $0.00 Contr. Marg. 47% 33% 0% 2nd Shift & Over- time 93% 59% 0% Auto mation Next Round 7.1 2.3 1.0 Capacity Next Round 1,095 605 444 193% 159% 0% 6.5 165% Baker Bold Low High 1,566 589 276 116 3/8/2022 9/2/2023 3.1 19800 1.0 22400 14.1 $33.40 10.9 $42.35 $11.41 $10.25 $17.03 $10.81 32% 34% 8.1 67% 56% 4.5 4.0 1,100 450 155% 950 Cake Cent Low High 1,390 319 262 7/28/2023 6 5/5/2023 2.3 17000 0.7 20000 5.8 6.8 13.4 $26.20 12.3 $39.20 $10.59 $13.60 $7.35 $9.86 29% 39% 72% 100% 7.0 45 171% 130% 420 Daze Dabble 340 1/8/2023 133 10/13/2023 1,431 507 3.1 19000 0.9 22000 6.6 52% 13.6 $34.00 11.3 $45.00 31% 40% $11.74 $10.41 $17.37 $9.56 9.0 1,050 600 4.2 3.2 152% 99% 0% Low High Low High Eat East 1,070 408 300 7/14/2023 40 3/15/2023 2.4 16500 0.8 17000 6.4 6.2 13.7 $28.60 12.8 $34.00 $10.69 $7.70 $11.62 $10.48 33% 33% 53% 89% 5.6 4.0 850 500 152% 149% Fast 574 9.3 Feast High High 399 188 10/7/2023 23 5/21/2023 1,5 22000 0.6 22000 8.9 10.4 $44.00 10.9 $44.00 $18.58 $9.47 $17.67 $10.48 36% 35% 10% 100% 4.0 4.0 500 600 109% 121% Round: 3 Dec. 31, 2023 Foundation Low Tech Segment Analysis Fast Track F118808_002 Low Tech Statistics Accessibility F118808_002 Low Tech Total Industry Unit Demand 6,708 Actual Industry Unit Sales 16,708 Andrews Segment % of Total Industry 164.3% Baldwin Next Year's Segment Growth Rate 10.0% Chester Low Tech Customer Buying Criteria Digby Expectations Importance Erie 1. Price $15.00 - 35.00 2. Age Ideal Age = 3.0 Ferris Reliability MTBF 14000-20000 4. Ideal Position Pfmn 6.3 Size 13.7 Perceptual Map for Low Tech Actual vs Potential Market Share Perceptual map (at end of this year) 20 2023 F118808_002 Low Tech 41% 29% 21% 9% 18 20% 16 14 t 15% 12 Size 10% 10 8 5% 6 0% 0 0 4 N Name Able Baker Cake Daze Eat East Cent Bold Fast A_Bria Market Share 22% 20% 18% 18% 14% 3% 2% 1% 0% 0% 8 8 10 12 14 16 18 20 Actual Potential Performance Top Products in Low Tech Segment Units Cust. Cust. Sold to Revision Stock Pimn Size List Age Promo Aware Sales Access- Seg Date Out Coord Coord Price MTBF Dec.31 Budget ness Budgetibility 1,478 12/10/2023 6.5 13.5 $33.99 18900 2.11 $1,500 100% $3.000 70% 1,366 3/8/2022 6.5 14.1 $33.40 19800 3.13 $1,350 84% $1,350 47% 1,235 7/28/2023 5.8 13.4 $26.20 17000 2.34 $1,025 60% $1,025 42% 1,220 1/8/2023 6.6 13.6 $34.00 19000 3.07 $1,450 90% $1,450 46% 953 7/14/2023 6.4 13.7 $28.60 16500 2.36 $875 53% $875 37% 201 3/15/2023 6.2 12.8 $34.00 17000 0.80 $875 42% $875 37% 129 5/5/2023 6.8 12.3 $39.20 20000 0.65 $1,025 47% $1,025 42% 91 9/2/2023 8.1 10.9 $42.35 22400 0.98 $1,350 54% $1,350 47% 20 10/7/2023 9.3 10.4 $44.00 22000 1.45 $1,500 93% $1.275 19% 15 12/21/2023 9.4 10.6 $44.50 19000 0.83 $2,000 86% $3,000 70% Dec. Cust Survey 31 28 25 26 19 6 5 1 0 Round: 3 Dec. 31, 2023 foundation High Tech Segment Analysis Fast Track F118808_002 High Tech Statistics Accessibility F118808_002 High Tech Total Industry Unit Demand 3,732 Actual Industry Unit Sales Andrews 13,732 Segment % of Total Industry 135.8% Baldwin Next Year's Segment Growth Rate 120.0% Chester High Tech Customer Buying Criteria Digby Expectations Importance Erie 1. Ideal Position Pfmn 9.5 Size 10.5 33% 2. Age Ideal Age = 0.0 29% Ferris 3. Price $25.00 - 45.00 25% 4. Reliability MTBF 17000-23000 13% 20% 60% Perceptual Map for High Tech Actual vs Potential Market Share Perceptual map (at end of this year) 20 2023 F118808_002 High Tech 18 25% 16 14 20% 15% 12 Size ILL. 10 10% 8 5% 6 0% 2 Andrews Baldwin Chester 0 0 4 Name A_Bria Fast Dabble Bold Feast Daze East Baker Cent Cake Eat Able Market Share 16% 15% 14% 13% 11% 6% 6% 5% 5% 4% 3% 3% 6 8 10 12 14 16 18 20 Actual Potential Performance Top Products in High Tech Segment Units Cust Cust. Sold to Revision Stock Pimn Size List Age Promo Aware Sales Access- Seg Date Out Coord Coord Price MTBF Dec.31 Budget ness Budgetibility 591 12/21/2023 9.4 10.6 $44.50 19000 0.83 $2,000 86% $3,000 79% 554 10/7/2023 9.3 10.4 $44.00 22000 1.45 $1,500 93% $1,275 54% 507 10/13/2023 9.0 11.3 $45.00 22000 0.93 $1,450 61% $1,450 66% 498 9/2/2023 8.1 10.9 $42.35 22400 0.98 $1,350 54% $1,350 61% 398 5/21/2023 8.9 10.9 $44.00 22000 0.61 $1,000 46% $1,275 54% 211 1/8/2023 6.6 13.6 $34.00 19000 3.07 $1,450 90% $1,450 66% 207 3/15/2023 6.2 12.8 $34.00 17000 0.80 $875 42% $875 34% 201 3/8/2022 6.5 14.1 $33.40 19800 3.13 $1,350 84% $1,350 61% 190 5/5/2023 6.8 12.3 $39.20 20000 0.65 $1,025 47% $1,025 40% 156 7/28/2023 5.8 13.4 $26.20 17000 2.34 $1,025 60% $1,025 40% 116 7/14/2023 6.4 13.7 $28.60 16500 2.36 $875 53% $875 104 12/10/2023 6.5 13.5 $33.99 18900 2.11 $1,500 100% $3,000 79% Dec. Cust Survey 41 33 30 26 29 8 10 7 13 7 6 34% 14 foundation Market Share Fast Track Round: 3 F118808_002 Dec 31, 2023 Units Sold vs Demand Chart F118808_002 Market Share F118808_002 20% 10% 6,000 5.000 4,000 3,000 2.000 1,000 0 Low High Industry Unit Sales Total Unit Demand Actual Market Share in Units Low High Industry Unit Sales 6.708 3,732 % of Market 64.3% 35.8% Total Low High Potential Market Share in Units Total Low High 10,441 Units Demanded 6,708 3,732 100.0% % of Market 64.3% 35.8% 15.2% Able 22.4% 2.8% 5.8%A_Bria 0.2% 15.7% 21.0% Total 22.7% 18.6% 10,441 100.0% Able A_Bria Total 22.0% 0.2% 22.3% 2.8% 15.8% 18.6% 15.4% 5.8% 21.2% Baker Bold Total 20.4% 1.4% 21.7% 5.4% 13.4% 18.7% 15.0% Baker 5.6% Bold 20.6% Total 20.2% 1.3% 21.6% 5.3% 13.3% 18.6% 14.9% 5.6% 20.5% Cake Cent Total 18.4% 1.9% 20.3% 4.2% 5.1% 9.3% 13.3% Cake 3.0% Cent 16.4% Total 18.3% 2.0% 20.3% 4.1% 5.2% 9.4% 13.2% 3.1% 16.4% 18.2% 18.1% Daze Dabble Total 5.7% 13.6% 19.3% 13.7% Daze 4.9% Dabble 18.6% Total 5.6% 13.5% 19.1% 13.6% 4.8% 18.4% 18.2% 18.1% 3.1% Eat East 14.2% 3.0% 17.2% 3.1% 5.5% 8.6% 10.2% Eat 3.9% East 14.1% Total 14.1% 3.0% 17.1% 5.5% 10.2% 3.9% 14.1% Total 8.6% 0.3% 0.3% Fast Feast Total 14.8% 10.7% 25.5% 5.5% Fast 3.8% Feast 9.3% Total 14.8% 11.0% 25.8% 5.5% 3.9% 9.4% 0.3% 0.3% Foundation Perceptual Map Round: 3 Fast Track F118808_002 Dec. 31, 2023 Perceptual Map for All Segments Perceptual map (at end of this year) 20 18 16 14 Dale Capate Fast Cent 12 Dabble BH AZIS 10 8 6 4 N 0 0 4 6 16 18 20 N 8 10 12 14 Performance Baldwin Andrews Chester Name Able A_Bria Pfmn 6.5 9.4 Size 13.5 10.6 Revised Name 12/10/2023 Baker 12/21/2023 Bold Pfmn 6.5 8.1 Size 14.1 10.9 Revised 3/8/2022 9/2/2023 Name Cake Cent Pfmn 5.8 6.8 Size 13.4 12.3 Revised 7/28/2023 5/5/2023 Digby Erie Ferris Name Daze Dabble Pfmn 6.6 9.0 Size 13.6 11.3 Revised Name 1/8/2023 Eat 10/13/2023 East Pfmn 6.4 6.2 Size 13.7 12.8 Revised 7/14/2023 3/15/2023 Name Fast Feast Pfmn 9.3 8.9 Size 10.4 10.9 Revised 10/7/2023 5/21/2023 8. Foundation HR/TQM Report Fast Track Round: 3 F118808_002 Dec. 31, 2023 HUMAN RESOURCES SUMMARY Andrews 378 374 Chester 242 242 136 106 Digby 399 399 301 98 Ferris 171 171 126 45 213 Needed Complement Complement 1st Shift Complement 2nd Shift Complement Overtime Percent Turnover Rate New Employees Separated Employees Recruiting Spend Training Hours Productivity Index Recruiting Cost Separation Cost Training Cost Total HR Admin Cost Strike Days 161 1.6% 6.8% 36 0 $5,000 80 109.1% $215 $0 $599 $814 Baldwin 427 427 261 166 0.0% 8.7% 98 0 $2,000 30 102.1% $295 $0 $256 $551 0.0% 8.4% 57 0 $1,500 40 102.4% $143 SO $194 $337 0.0% 8.7% 63 0 $2,000 30 102.2% $189 $0 $239 $429 Erie 249 249 153 96 0.0% 8.6% 96 0 $2,500 35 102.4% $335 SO $174 $509 0.0% 8.4% 14 44 $3,000 40 104.5% $58 $221 $137 $416 TQM SUMMARY Andrews Baldwin Chester Digby Erie Ferris Process Mgt Budgets Last Year CPI Systems VendorJIT Quality Initiative Training Channel Support Systems Concurrent Engineering UNEP Green Programs SO $0 $0 $0 $0 $0 $0 $0 $0 SO SO SO SO SO $0 $0 $0 $0 $0 $0 $0 SO $0 SO $0 SO $0 $0 $0 $0 $0 $0 $0 $O $0 $0 $0 $0 $0 $0 $0 SO $0 SO SO SO $0 $0 $0 $0 $0 SO SO SO $0 SO $0 $0 $0 $0 $0 SO TQM Budgets Last Year Benchmarking Quality Function Deployment Effort CCE/6 Sigma Training GEMI TQEM Sustainability Initiatives Total Expenditures Cumulative Impacts Material Cost Reduction Labor Cost Reduction Reduction R&D Cycle Time Reduction Admin Costs Demand Increase 0.00% 0.00% 0.00% 0.00% 0.00% 0.00% 0.00% 0.00% 0.00% 0.00% 0.00% 0.00% 0.00% 0.00% 0.00% 0.00% 0.00% 0.00% 0.00% 0.00% 0.00% 0.00% 0.00% 0.00% 0.00% 0.00% 0.00% 0.00% 0.00% 0.00% $0 Annual Report Andrews Round: 3 F118808_002 Dec. 31, 2023 2023 Income Statement (Product Name) Able Common A_Bria 2023 A_Grad Total Size Sales $53,780 $26.957 $0 SO $0 $0 SO $80,737 100.0% Variable Costs: Direct Labor $11,862 $7,792 $0 $0 $0 $0 $0 $0 $19,654 24.3% Direct Material $16,356 $9,488 SO $0 SO $0 $0 SO $25,844 32.0% Inventory Carry $348 $710 $0 $0 $0 $0 $0 $0 $1,058 1.3% Total Variable $28,566 $17.990 $0 $0 SO $0 $0 SO $46,557 57.7% Contribution Margin $25,213 $8,967 $0 $0 SO $0 $0 SO $34,180 42.3% Period Costs: Depreciation $2,511 $613 $0 $0 SO $0 $0 SO $3,124 3.9% SG&A: R&D $955 $985 $1,000 $0 SO $0 $0 $0 $2,939 3.6% Promotions $1,500 $2,000 $0 $0 SO $0 $0 SO $3,500 4.3% Sales $3,000 $3,000 $0 $0 SO $0 $0 $0 $6,000 7.4% Admin $1,349 $676 $0 $0 SO $0 $0 SO $2,025 2.5% Total Period $9,315 $7,274 $1.000 $0 SO $0 $0 SO $17,588 21.8% Net Margin $15,899 $1,693 ($1,000) $0 SO $0 $0 $0 $16,592 20.6% Defintions: Sales: Unit Sales times ist price. Direct Labor: Labor costs incurred to produce the product Other $392 0.5% that was sold. Inventory Carry Cost the cost unsold goods in inventory, Depreciation Calculated on EBIT $16,200 20.1% straight-ine. 15-year depreciation of plant value. R&D Costs: R&D department expenditures for each Short Term Interest $653 0.8% product. Admin Administration overhead is estimated at 1.5% of sales. Promotions: The promotion budget Long Term Interest $2,157 2.7% for each product Sales: The sales force budget for each product. Other: Chargs not included in other Taxes $4.687 5.8% categories such as Fees, Write offs, and TQM. The fees include money paid to investment bankers and Profit Sharing $174 0.2% brokerage fims to issue new stocks or bonds plus consulting fees your instructor might assess. Write-offs Net Profit $8.529 10.6% include the loss you might experience when you sel capacity or liquidate inventory as the result of eliminating a production line. If the amount appears as a negative amount, then you actualy made money Variable Margins on the iquidation of capacy or inventory. EBIT: Eamings Before Interest and Taxes. Short Term Interest: 2023 Andrews F118808_002 Interest expense based on last years current debt, including short term debt, long term notes that have become due, and emergency loans, Long Term Interest: Interest paid on outstanding bonds. Taxes: Income tax based upon a 35% tax rate. Profit Sharing Profts shared with employees under the labor contract. Net Profit EBIT minus interest, taxes, and profit sharing. 40 20 Able A_Bria A Grad Profit History F118808_002 Market Share History F118808_002 20% 10% $5,000 50 2020 2021 2022 2023 2020 2021 2022 2023 ROE History F118808_002 30% 20% 10% 2020 2021 Asset Turnover History F118808_002 2.0 1.0 0.0 2020 2021 2022 2022 2023 2023 ROA History F118808_002 20% ROS History F118808_002 10% 5%. 10% 2020 2021 2022 2023 2021 2023
Step by Step Solution
There are 3 Steps involved in it
Step: 1

Get Instant Access to Expert-Tailored Solutions
See step-by-step solutions with expert insights and AI powered tools for academic success
Step: 2

Step: 3
Ace Your Homework with AI
Get the answers you need in no time with our AI-driven, step-by-step assistance
Get Started
Accounting
Authors: Jonathan E. Duchac, James M. Reeve, Carl S. Warren
23rd Edition
978-0324662962