Answered step by step
Verified Expert Solution
Question
1 Approved Answer
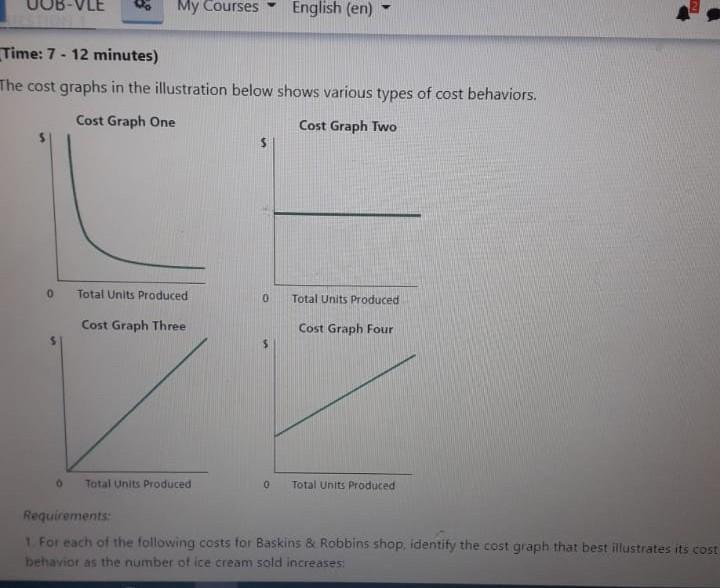
My Courses English (en) Time: 7 - 12 minutes) The cost graphs in the illustration below shows various types of cost behaviors. Cost Graph One


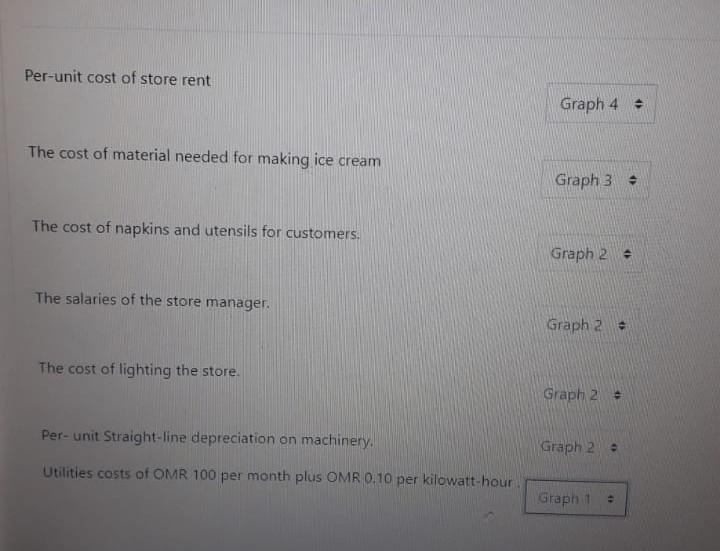
My Courses English (en) Time: 7 - 12 minutes) The cost graphs in the illustration below shows various types of cost behaviors. Cost Graph One Cost Graph Two 0 Total Units Produced Total Units Produced Cost Graph Three Cost Graph Four 0 Tatal Units Produced 0 Total Units Produced Requirements: 1 For each of the following costs for Baskins & Robbins shop, identify the cost graph that best illustrates its cost behavior as the number of ice cream sold increases: Per-unit cost of store rent Graph 4 - The cost of material needed for making ice cream Graph 3 The cost of napkins and utensils for customers. Graph 2 - The salaries of the store manager. Graph 2 - The cost of lighting the store. Graph 2 Per-unit Straight-line depreciation on machinery Graph 2 Utilities costs of OMR 100 per month plus OMR 0.10 per kilowatt-hour Grapht
Step by Step Solution
There are 3 Steps involved in it
Step: 1

Get Instant Access to Expert-Tailored Solutions
See step-by-step solutions with expert insights and AI powered tools for academic success
Step: 2

Step: 3

Ace Your Homework with AI
Get the answers you need in no time with our AI-driven, step-by-step assistance
Get Started


