Answered step by step
Verified Expert Solution
Question
1 Approved Answer
My question 1 bellow We analyse a data set that consists of test scores and class sizes of 420 1'v'ictorian school districts in 2020 that
My question 1 bellow
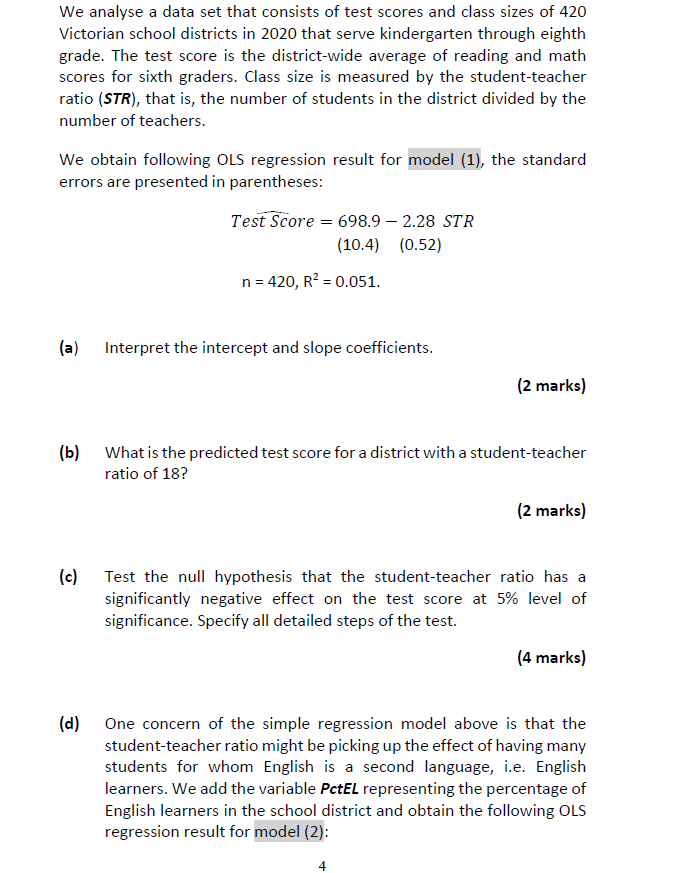
 We analyse a data set that consists of test scores and class sizes of 420 1'v'ictorian school districts in 2020 that serve kindergarten through eighth grade. The test score is the district-wide average of reading and math scores for sixth graders. Class size is measured by the studentteacher ratio [5TH], that isl the number of students in the district divided bv the number of teachers. We obtain following 0L5 regression result for model {1}, the standard errors are presented in parentheses: TsstScors = 698.9 2.28 STE {10.4} {13.52} n = 42o, R2 = [1.051. {a} Interpret the intercept and slope coefficients. {2 marks] {b} What is the predicted test score for a district with a studentteacher ratio of 13? {2 marks] {4:} Test the null hvpothesis that the studentteacher ratio has a significantlyf negative effect on the test score at 5% level of significance. Specifv all detailed steps of the test. {4 marks] {d} One concern of the simple regression model above is that the studentteacher ratio might be picking up the effect of having manv students for whom English is a second language, i.e. English learners. We add the variable PctEl. representing the percentage of English learners in the school district and obtain the following OILS regression result for model [I]: 4
 Step by Step Solution
There are 3 Steps involved in it
Step: 1

Get Instant Access to Expert-Tailored Solutions
See step-by-step solutions with expert insights and AI powered tools for academic success
Step: 2

Step: 3

Ace Your Homework with AI
Get the answers you need in no time with our AI-driven, step-by-step assistance
Get Started


