My questions:
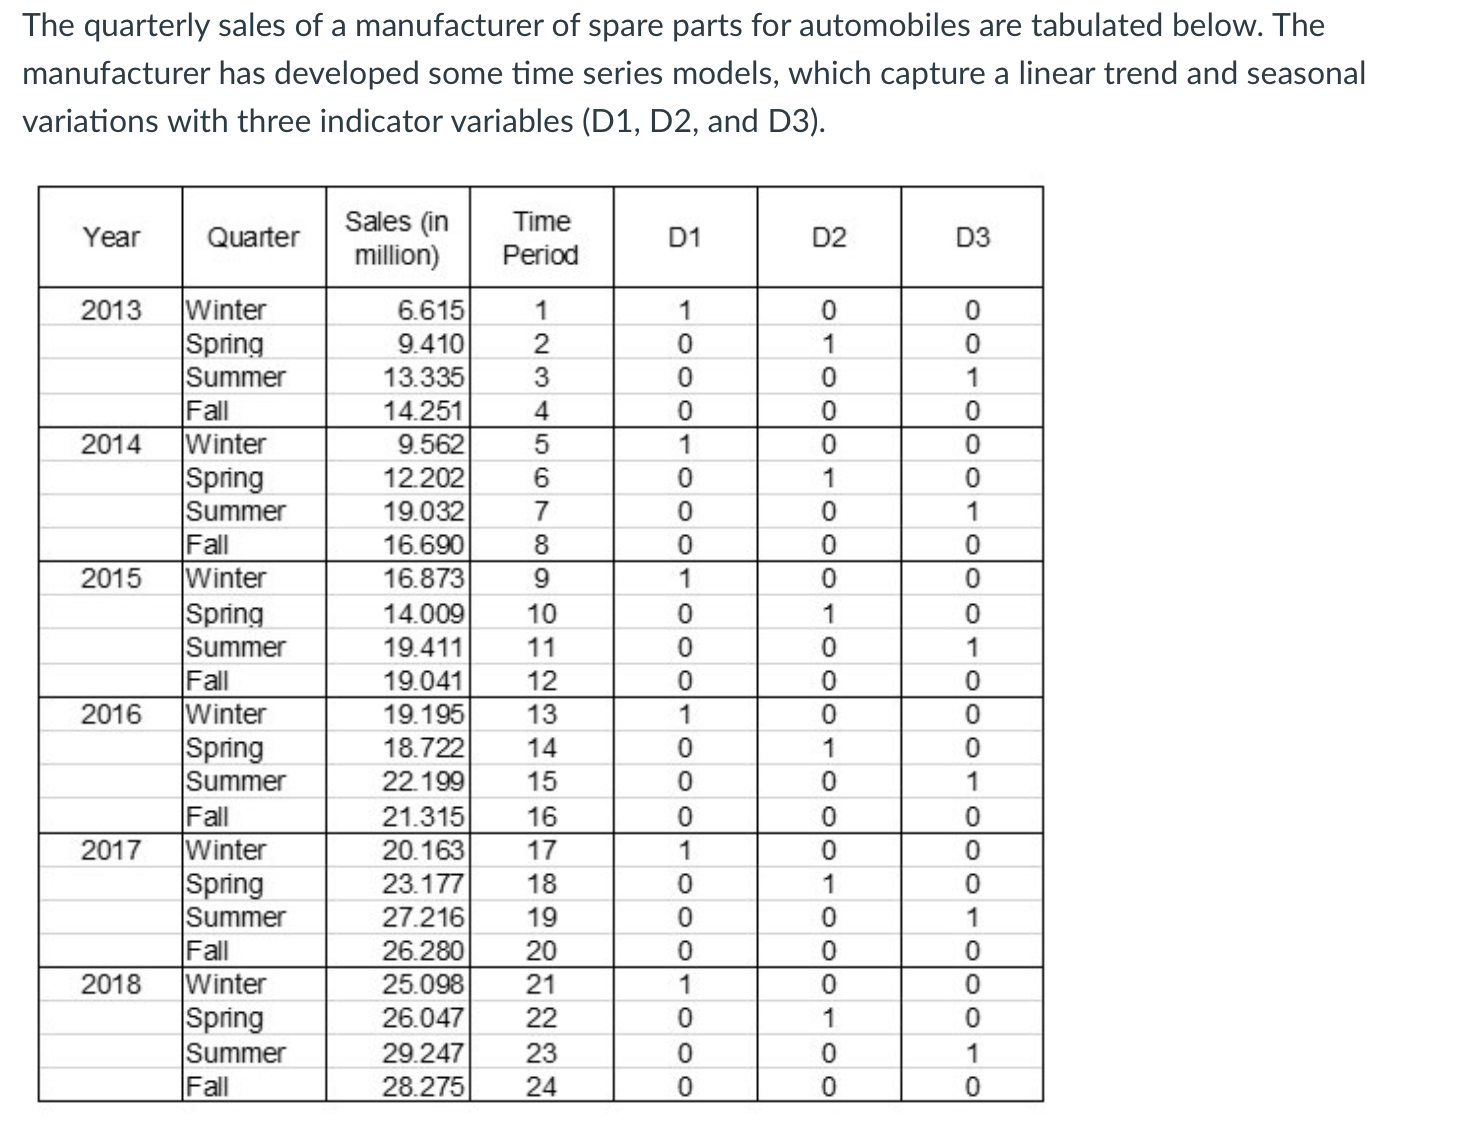
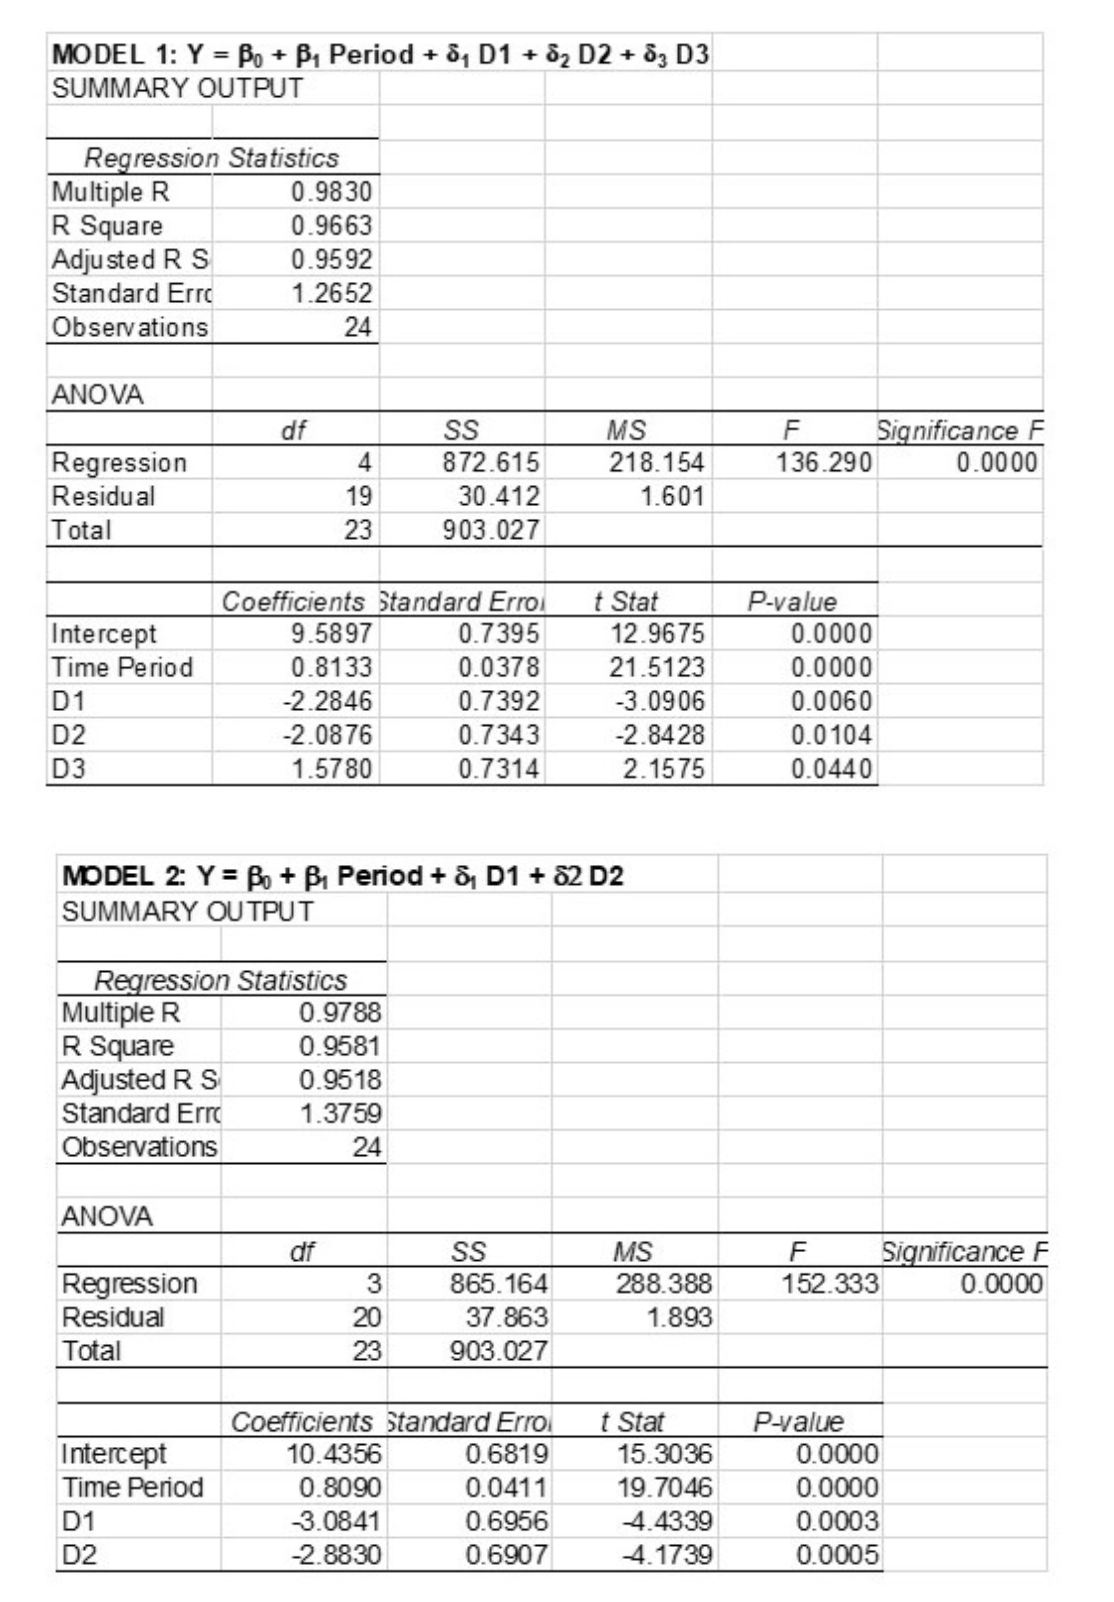
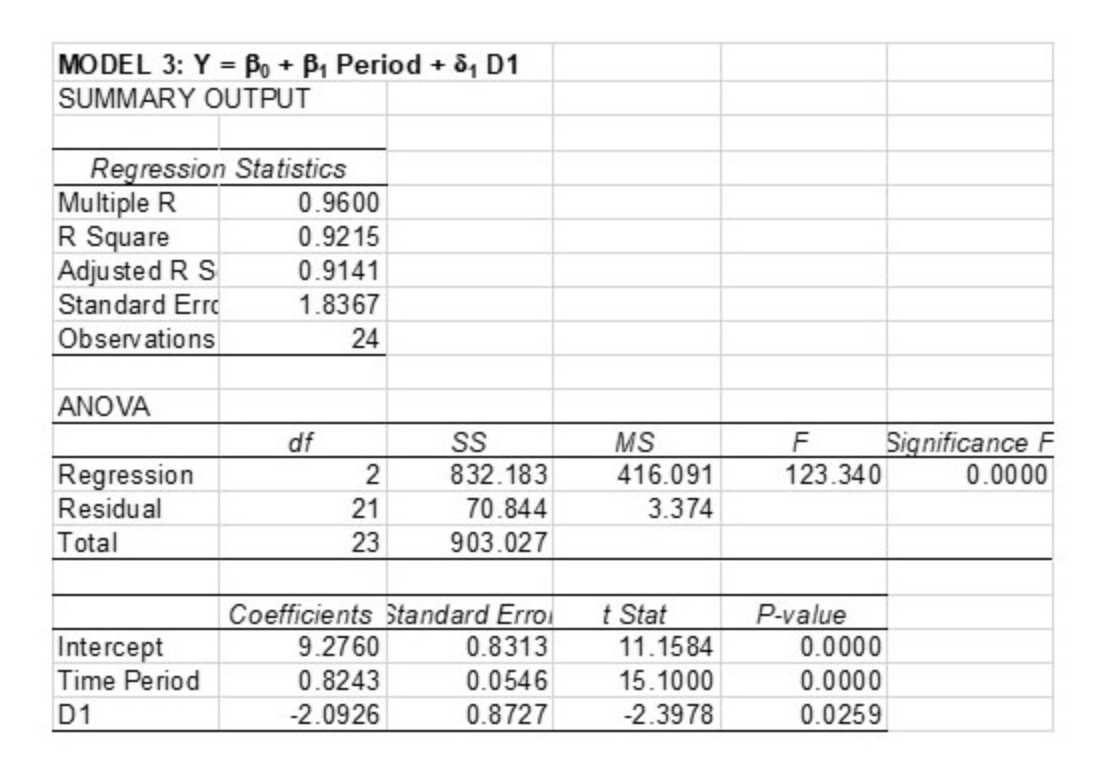
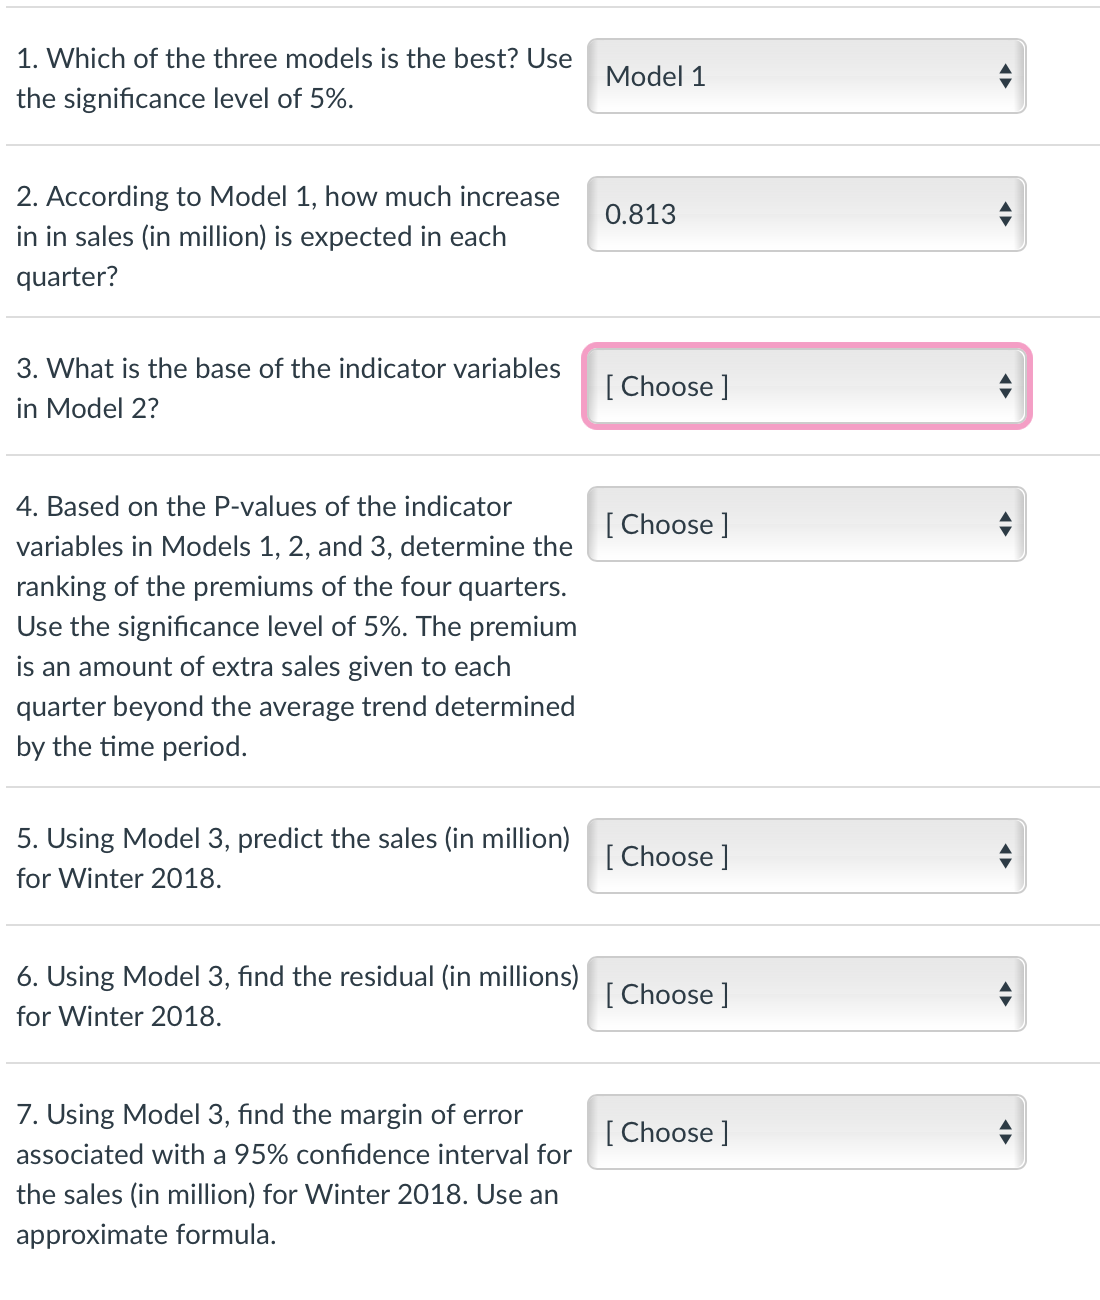
The quarterly sales of a manufacturer of spare parts for automobiles are tabulated below. The manufacturer has developed some time series models, which capture a linear trend and seasonal variations with three indicator variables (D1, D2, and D3). Sales (In Time i U o: 1 2 3 4 5 6 7 8 17 18 19 20 21 22 23 24 MODEL 1: Y = Bo + By Period + 8, D1 + 82 D2 + 83 D3 SUMMARY OUTPUT Regression Statistics Multiple R 0.9830 R Square 0.9663 Adjusted R S 0.9592 Standard Erro 1.2652 Observations 24 ANOVA df SS MS F Significance F Regression 4 872.615 218.154 136.290 0.0000 Residual 19 30.412 1.601 Total 23 903.027 Coefficients Standard Errol t Stat P-value Intercept 9.5897 0.7395 12.9675 0.0000 Time Period 0.8133 0.0378 21.5123 0.0000 D1 -2.2846 0.7392 -3.0906 0.0060 D2 -2.0876 0.7343 -2.8428 0.0104 D3 1.5780 0.7314 2.1575 0.0440 MODEL 2: Y = Bo + B, Period + & D1 + 82 D2 SUMMARY OUTPUT Regression Statistics Multiple R 0.9788 R Square 0.9581 Adjusted R S 0.9518 Standard Erro 1.3759 Observations 24 ANOVA df SS MS F Significance F Regression 3 865.164 288.388 152.333 0.0000 Residual 20 37.863 1.893 Total 23 903.027 Coefficients Standard Errol t Stat P-value Intercept 10.4356 0.6819 15.3036 0.0000 Time Period 0.8090 0.0411 19.7046 0.0000 D1 3.0841 0.6956 -4.4339 0.0003 D2 -2.8830 0.6907 4.1739 0.0005MODEL 3: Y = Po + B, Period + 8, D1 SUMMARY OUTPUT Regression Statistics Multiple R 0.9600 R Square 0.9215 Adjusted R S 0.9141 Standard Erro 1.8367 Observations 24 ANOVA df SS MS F Significance F Regression 2 832.183 416.091 123.340 0.0000 Residual 21 70.844 3.374 Total 23 903.027 Coefficients Standard Errol t Stat P-value Intercept 9.2760 0.8313 11.1584 0.0000 Time Period 0.8243 0.0546 15.1000 0.0000 D1 -2.0926 0.8727 -2.3978 0.02591. Which of the three models is the best? Use Model 1 the significance level of 5%. 2. According to Model 1, how much increase 0.813 in in sales (in million) is expected in each quarter? 3. What is the base of the indicator variables [ Choose ] in Model 2? 4. Based on the P-values of the indicator [ Choose ] variables in Models 1, 2, and 3, determine the ranking of the premiums of the four quarters. Use the significance level of 5%. The premium is an amount of extra sales given to each quarter beyond the average trend determined by the time period. 5. Using Model 3, predict the sales (in million) [ Choose ] for Winter 2018. 6. Using Model 3, find the residual (in millions) [ Choose ] for Winter 2018. 7. Using Model 3, find the margin of error [ Choose ] associated with a 95% confidence interval for the sales (in million) for Winter 2018. Use an approximate formula