My team is team Delta.
Based on the regression analysis provided and the data provided, please:
1. Which teams are competing against each other?
2. Is the demand function provided correct for team Delta?
3. Is the cost function provided correct for team Delta?
4. What is the best profit maximizing price for team Delta?
5. What is the Nash Equilibrium for this market?
6. What would be the cooperative outcome for these teams? Would this cooperative outcome be an "equilibrium"? Was the cooperative outcome achieved in the experiment?
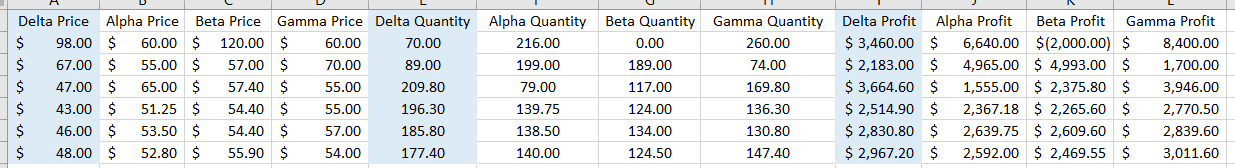
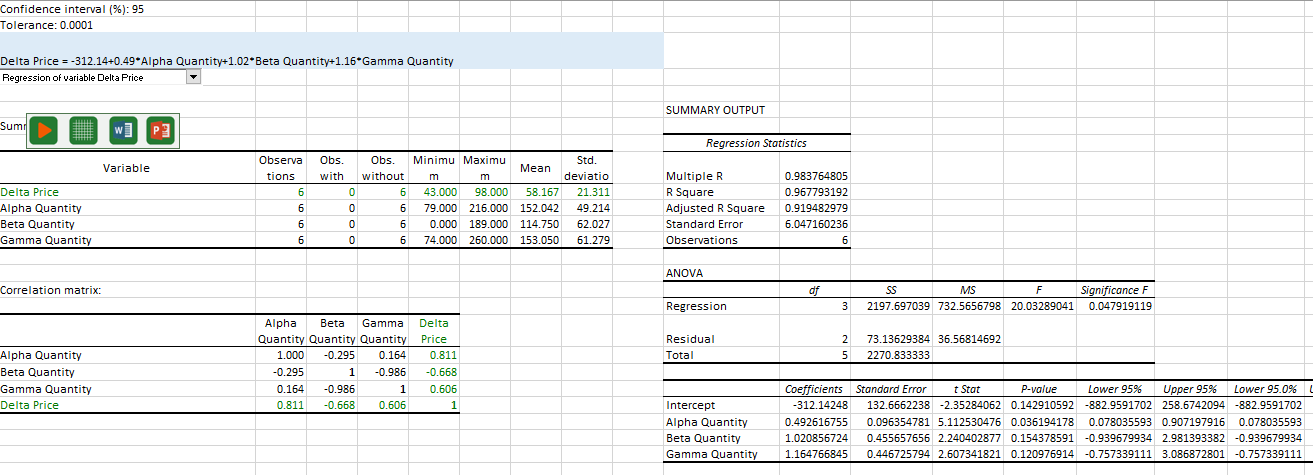
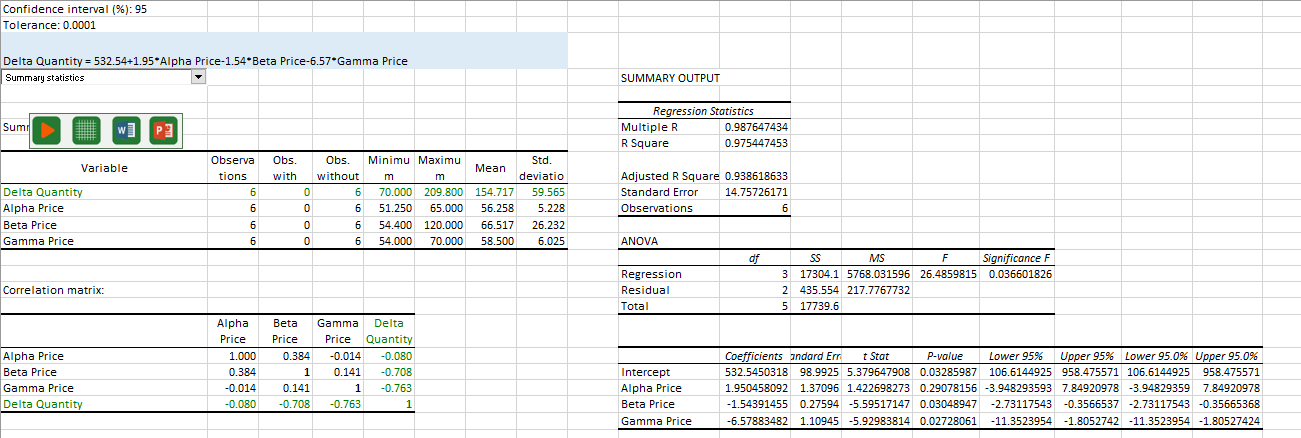
Delta Price Alpha Price Beta Price Gamma Price Delta Quantity Alpha Quantity Beta Quantity Gamma Quantity Delta Profit Alpha Profit Beta Profit Gamma Profit 98.00 $ 60.00 $ 120.00 $ 60.00 70.00 216.00 0.00 260.00 $ 3,460.00 $ 6,640.00 $(2,000.00) $ 8,400.00 67.00 $ 55.00 $ 57.00 70.00 89.00 199.00 189.00 74.00 $ 2,183.00 4,965.00 $ 4,993.00 $ 1,700.00 47.00 $ 65.00 $ 57.40 55.00 209.80 79.00 117.00 169.80 $ 3,664.60 $ 1,555.00 $ 2,375.80 S 3,946.00 43.00 $ 51.25 54.40 55.00 196.30 139.75 124.00 136.30 $ 2,514.90 2,367.18 $ 2,265.60 $ 2,770.50 46.00 $ 53.50 $ 54.40 $ 57.00 185.80 138.50 134.00 130.80 $ 2,830.80 $ 2,639.75 $ 2,609.60 $ 2,839.60 48.00 $ 52.80 55.90 54.00 177.40 140.00 124.50 147.40 $ 2,967.20 $ 2,592.00 $ 2,469.55 $ 3,011.60Confidence interval (%):95 Tolerance: 0.0001 Delta Price = -312.14+0.49*Alpha Quantity+1.02*Beta Quantity+1.16*Gamma Quantity Regression of variable Delta Price SUMMARY OUTPUT Sum D w ] P 3 Regression Statistics Std. Variable Observa Obs. Obs. Minimu Maximu tions with without Mean m m deviation Multiple R 0.983764805 Delta Price 6 6 43.000 98.000 58.167 21.311 R Square 0.967793192 Alpha Quantity 79.000 216.000 152.042 49.214 Adjusted R Square 0.919482979 Beta Quantity 0.000 189.000 114.750 62.027 Standard Error 6.047160236 Gamma Quantity 6 74.000 260.000 153.050 61.279 Observations 6 ANOVA Correlation matrix: SS MS F Significance F Regression 3 2197.697039 732.5656798 20.03289041 0.047919119 Alpha Beta Gamma Delta Quantity Quantity Quantity Price Residual 73.13629384 36.56814692 Alpha Quantity 1.000 0.295 0.164 0.811 Total UnT N 2270.833333 Beta Quantity -0.295 0.986 -0.668 Gamma Quantity 0.164 -0.986 0.606 Coefficients Standard Error t Stat P-value Lower 95% Upper 95% Lower 95.0% Delta Price 0.811 -0.668 0.606 Intercept 312.14248 132.6662238 -2.35284062 0.142910592 -882.9591702 258.6742094 -882.9591702 Alpha Quantity 0.492616755 0.096354781 5.112530476 0.036194178 0.078035593 0.907197916 0.078035593 Beta Quantity 1.020856724 0.455657656 2.240402877 0.154378591 -0.939679934 2.981393382 -0.939679934 Gamma Quantity 1.164766845 0.446725794 2.607341821 0.120976914 -0.757339111 3.086872801 -0.757339111Confidence interval (%): 95 Tolerance: 0.0001 Delta Quantity = 532.54+1.95*Alpha Price-1.54*Beta Price-6.57*Gamma Price Summary statistics SUMMARY OUTPUT Regression Statistics Sum D WE Ed Multiple R 0.987647434 R Square 0.975447453 Variable Observa Obs. Obs. Minimu Maximu Mean Std tions with without m deviation Adjusted R Square 0.938618633 Delta Quantity 6 70.000 209.800 154.717 59.565 Standard Error 14.75726171 Alpha Price 6 51.250 65.000 56.258 5.228 Observations 6 Beta Price 6 54.400 120.000 66.517 26.232 Gamma Price 6 54.000 70.000 58.500 6.025 ANOVA of SS MS F Significance F Regression 3 17304.1 5768.031596 26.4859815 0.036601826 Correlation matrix: Residual 2 435.554 217.7767732 Total 5 17739.6 Alpha Beta Gamma Delta Price Price Price Quantity Alpha Price 1.000 0.384 -0.014 -0.080 Coefficients andard Err t Stat P-value Lower 95% Upper 95% Lower 95.0% Upper 95.0% Beta Price 0.384 0.141 -0.708 Intercept 532.5450318 98.9925 5.379647908 0.03285987 106.6144925 958.475571 106.6144925 958.475571 Gamma Price -0.014 0.141 1 -0.763 Alpha Price 1.950458092 1.37096 1.422698273 0.29078156 -3.948293593 7.84920978 -3.94829359 7.84920978 Delta Quantity -0.080 -0.708 -0.763 Beta Price -1.54391455 0.27594 -5.59517147 0.03048947 -2.73117543 -0.3566537 -2.73117543 -0.35665368 Gamma Price 6.57883482 1.10945 - -5.92983814 0.02728061 -11.3523954 -1.8052742 -11.3523954 -1.80527424