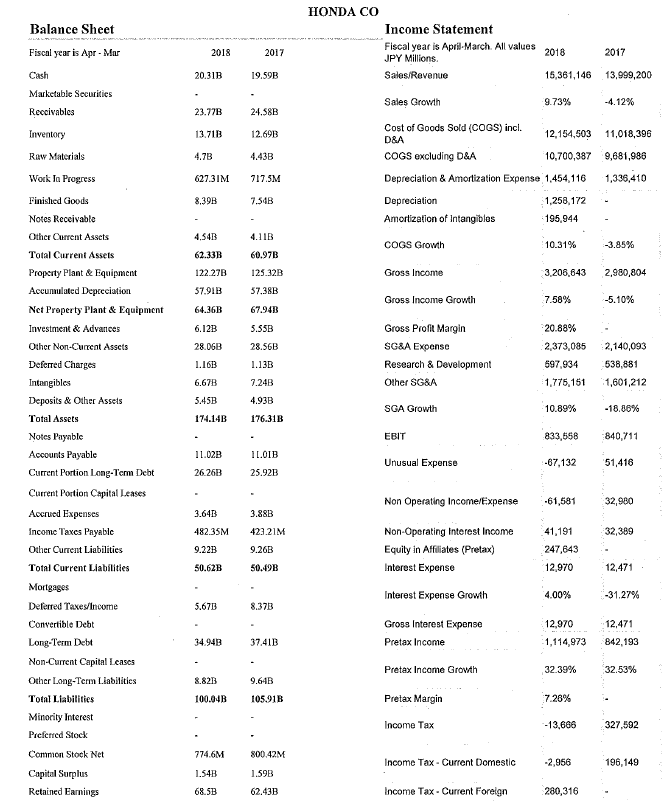
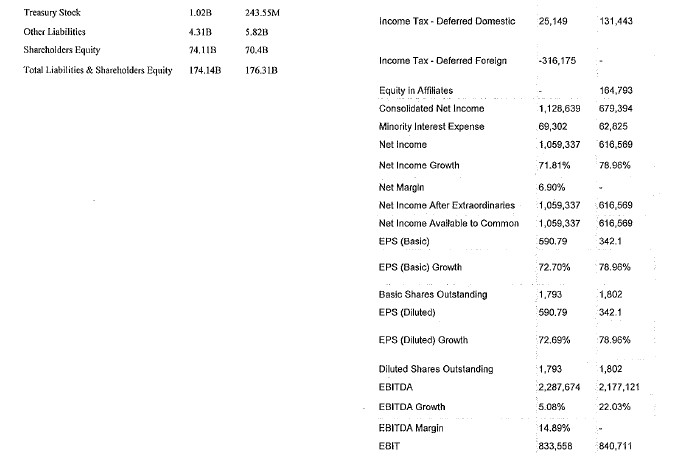
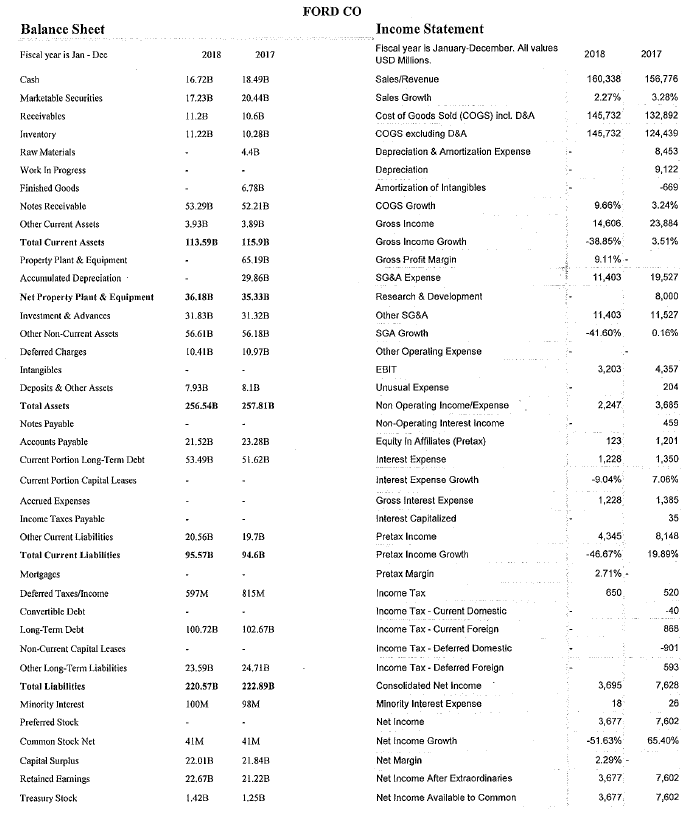
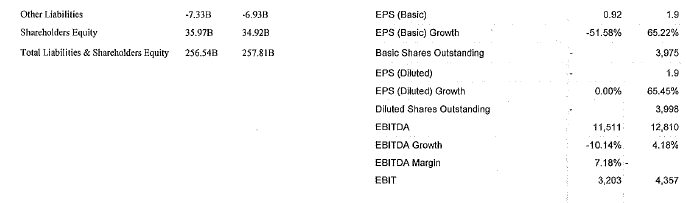
My Two Companies: Honda Motor Company and Ford Motor Company
2. (Financial Ratio Analysis) Using 2017 & 2018 Balance sheet & Income statement for each company, compute the following financial ratios for each company:
5) Inventory Turnover
= COGS / Inventory
6) Receivable turnover
= Sales / Accts. Rec.
7) Total asset turnover
= Sales / Total Assets
8) Profit margin
= Net Income / Sales
9) Return on Asset (ROA)
= Net Income / Total Assets
10) Return on Equity (ROE)
= Net Income / Total Equity
11) Price-earnings ratio
= Price Per Share / Earnings Per Share
12) Market-to-book ratio
= Market Value Per Share / Book Value Per Share
HONDA CO Balance Sheet Fiscal year is Apr- Mar Cash Marketable Securities Income Statement Fiscal year is April-March Al values2018 2017 JPY Millions Sales Revenue Sales Growih Cost of Goods Sold (COGS) incl. 20.31B 19.59B 15,361,146 13,999,200 9.73% 23.77B 24.58B 13.71B 12.69B 12,154,503 11,018,396 D&A COGS excluding D&A Depreciation & Amortization Expense 1,454,116 Depreciation Amortization of Intangiblas COGS Growh Raw Materials Work Ia Progress Finished Goods Notes Receivable Othcr Current Assets Total Current Assets Property Plant&Equipment Accumulated Depteciation Nct Preperty Plant &Equipment Investment &Advances Other Non-Current Assets Deferred Charges Intangibles Deposits & Other Assels Total Assets Notes Paynble Accounts Current Portion Long-Tcrm Debt Current Portion Capital Leases Accrued Expenses Income Taxes Payablc Other Current Liabilities Total Current Liabilities Mortgage Deferred Taxes/Income Convertible Debt 10,700,387 9,681,986 627.31M 17.5M 1,336,410 8,39B 7.34B 1,258,172 195,944 10.31% 4,54B -3.85% 122.27B 57.91 64.36B 60.97B 125.32B 37.38B 67.94B Gross Income 3,206,643 2.980,804 Gross Income Growth -5.10% Gross Profit Margin SG&A Expense Research & Development Other SG&A 20.88% 2,373,035 2,140,093 597,934 1,775,151 601,212 10.89% 28.06B 28.56B 538,881 6.67B 7.24B 4.93B 176.31B SGA Growth 18.00% 174.14B EBIT 833,658 840,711 Payable Unusual Expense 2626B 25.92B Non Operating Incomex61,581 32,980 Non-Operating Interest Income Equity in Affiliates (Pretax) Interest Expense 32,389 482.35M 423.21M 9.22B 50.62B 9.26B 247,643 - 5049B Interest Expense Growth 4.00% 8.37B Gross Interest Expense 12,970 1,114,973 842,193 32.39% 729% 34.94B Pretax Income Non-Current Capital Leascs Other Long-Term Liabilities Total Liabilities Minority Interest Prefcrred Stock Common Stock Net Pretax Income Grovth 325% 8.82B 100.04B 105.91B Pretax Margin 13,686 327,592 74.6M 1.54B 68.5B 800,42M Income Tax- Current Domestic 196,149 lus Retained Earnings 62.43B Income Tax Current Foreign Treasury Stock Other Liabilities Sharcholders Equity Total Liabilities& Shareholders Equity 1.02B 4.31B 74,118 74.14B 176.31B 243.55M 5.82B 70.4 Income Tax Deferred Domestic 25,149 131,443 Income Tax Deferred Foreign 316,175 - 164,793 Equity in Affiliates Consolidated Net Income Minority Interest Expense Net Income Net Income Growth Net Margin Net Income After Extraordinaries 1,059,337616,569 Net Income Avaiable to Common ,059,337616,569 EPS (Basic) EPS (Basic) Growth 1,128,639 679,394 69,302 1,059,337 616,569 71.81% 6.90% 62,825 78.96% 342.1 78.98% 1,802 590.79 72T0% 1,793 Basic Shares Outstanding EPS (Diluted) 590.79 342.1 EPS (Diluted) Growth 78.96% Diluted Shares Outstanding EBITDA EBITDA Growth EBITDA Margin EBIT 1,793 2,287,674 2,177,121 5.08% 14.89% 833,558 840,711 1,802 22.03% FORD CO Balance Sheet Income Statement Fiscal year is January-December. Alil values Fiscal ycar is Jan Dec 2017 2017 USD Millions. Sales Revenue Sales Growth Cost of Goods Sold (COGS) incl D&A COGS excluding D&A Depreciation & Amortization Expense Depreciation Amortization of Intangibles COGS Growth Gross Income Gross Income Growth Gross Profit Margin SG&A Expense Research & Development Other SG&A SGA Growth Other Operaling Expense EBIT Unusual Expense Non Operating Income/Expense Non-Operating Interest income Equity in Afillates (Pretax) Interest Expense Interest Expense Growth Gross Interest Expense Inlerest Capitalized Pretax Income Prelax Income Growth Pretax Margin 160,338 156,778 3.28% 145,732 132,892 145,732 124,439 849B 2.27% Marketable Secuities Receivables Inventory Raw Materials Work In Progress Finished Goods Notes Receivable Other Current Assels Total Current Assets Property Plant&Equipment Accumulated Depreciation Net Properly Plant& Equipment Investment & Advances Other Non-Curreat Assets Deferred Charges 7.23B 20.44B 1122B 6.78B 3.24% 23,884 3.51% 53.29B 5221B 9.66% 3.93B -38.85% 113.59B 115.9B 65,19B 29.86B 35.33B 9.11% . 11,403 19,527 3618B 31.83B 36.61B 041B 11,403 56.18B 0.16% 10.97B 3,203 Deposits&Other Assets Total Assets Notes Payable Accounts Payable Current Portion Long-Term Dcbt Current Portion Capital Leases Accrued Expenses Income Taxes Payable Other Curent Liabilities Total Current Liabilities 7.93B 8.1B 256.54B 25781B 2,247 459 21.52B 23.28B 53.49B 51.62B 1,385 35 20.56B 19.7B 95.573 94.6B -46.67% 19.89% 2.71% ax 520 Income Tax Current Domestic Income Tax- Curent Foreign income Tax Deferred Domestic Income Tax Deferred Foreign Consolidated Net Income Minority Interest Expense Net Income Net Income Growth Net Margin Net Income After Extraordinaies Net Income Available to Common Convertible Debt 100.72B102.67B 868 Non-Curet Capital Leases Other Long-Term Liabilities Total Liabilittes Mi Preferred Stock Common Stock Net -901 23.59B 220.57B222.89B 3,695 26 65.40% 22.01B 22.67B 1.42B 41M 21.84B 21.22B 1.25B Retained Eanings Treasury Stock 7,602 Other Liabilities Shareholders Equity Total Liabilities & Shareholders Equity 7.33B 35.97B 256.54B257.81B 6.93B EPS (Basic) EPS (Basic) Growth Basic Shares Outstanding EPS (Diluted) EPS (Diluted) Growth Diluted Shsres Outstanding EBITDA EBITDA Growth EBITDA Margin EeIT 0.92 1.9 65.22% 3,975 1.9 65.45% 3,998 12,810 4.18% 34.92B -51.58% 0.00% 11,511 10.14% 7.18% 3,203 4,357 HONDA CO Balance Sheet Fiscal year is Apr- Mar Cash Marketable Securities Income Statement Fiscal year is April-March Al values2018 2017 JPY Millions Sales Revenue Sales Growih Cost of Goods Sold (COGS) incl. 20.31B 19.59B 15,361,146 13,999,200 9.73% 23.77B 24.58B 13.71B 12.69B 12,154,503 11,018,396 D&A COGS excluding D&A Depreciation & Amortization Expense 1,454,116 Depreciation Amortization of Intangiblas COGS Growh Raw Materials Work Ia Progress Finished Goods Notes Receivable Othcr Current Assets Total Current Assets Property Plant&Equipment Accumulated Depteciation Nct Preperty Plant &Equipment Investment &Advances Other Non-Current Assets Deferred Charges Intangibles Deposits & Other Assels Total Assets Notes Paynble Accounts Current Portion Long-Tcrm Debt Current Portion Capital Leases Accrued Expenses Income Taxes Payablc Other Current Liabilities Total Current Liabilities Mortgage Deferred Taxes/Income Convertible Debt 10,700,387 9,681,986 627.31M 17.5M 1,336,410 8,39B 7.34B 1,258,172 195,944 10.31% 4,54B -3.85% 122.27B 57.91 64.36B 60.97B 125.32B 37.38B 67.94B Gross Income 3,206,643 2.980,804 Gross Income Growth -5.10% Gross Profit Margin SG&A Expense Research & Development Other SG&A 20.88% 2,373,035 2,140,093 597,934 1,775,151 601,212 10.89% 28.06B 28.56B 538,881 6.67B 7.24B 4.93B 176.31B SGA Growth 18.00% 174.14B EBIT 833,658 840,711 Payable Unusual Expense 2626B 25.92B Non Operating Incomex61,581 32,980 Non-Operating Interest Income Equity in Affiliates (Pretax) Interest Expense 32,389 482.35M 423.21M 9.22B 50.62B 9.26B 247,643 - 5049B Interest Expense Growth 4.00% 8.37B Gross Interest Expense 12,970 1,114,973 842,193 32.39% 729% 34.94B Pretax Income Non-Current Capital Leascs Other Long-Term Liabilities Total Liabilities Minority Interest Prefcrred Stock Common Stock Net Pretax Income Grovth 325% 8.82B 100.04B 105.91B Pretax Margin 13,686 327,592 74.6M 1.54B 68.5B 800,42M Income Tax- Current Domestic 196,149 lus Retained Earnings 62.43B Income Tax Current Foreign Treasury Stock Other Liabilities Sharcholders Equity Total Liabilities& Shareholders Equity 1.02B 4.31B 74,118 74.14B 176.31B 243.55M 5.82B 70.4 Income Tax Deferred Domestic 25,149 131,443 Income Tax Deferred Foreign 316,175 - 164,793 Equity in Affiliates Consolidated Net Income Minority Interest Expense Net Income Net Income Growth Net Margin Net Income After Extraordinaries 1,059,337616,569 Net Income Avaiable to Common ,059,337616,569 EPS (Basic) EPS (Basic) Growth 1,128,639 679,394 69,302 1,059,337 616,569 71.81% 6.90% 62,825 78.96% 342.1 78.98% 1,802 590.79 72T0% 1,793 Basic Shares Outstanding EPS (Diluted) 590.79 342.1 EPS (Diluted) Growth 78.96% Diluted Shares Outstanding EBITDA EBITDA Growth EBITDA Margin EBIT 1,793 2,287,674 2,177,121 5.08% 14.89% 833,558 840,711 1,802 22.03% FORD CO Balance Sheet Income Statement Fiscal year is January-December. Alil values Fiscal ycar is Jan Dec 2017 2017 USD Millions. Sales Revenue Sales Growth Cost of Goods Sold (COGS) incl D&A COGS excluding D&A Depreciation & Amortization Expense Depreciation Amortization of Intangibles COGS Growth Gross Income Gross Income Growth Gross Profit Margin SG&A Expense Research & Development Other SG&A SGA Growth Other Operaling Expense EBIT Unusual Expense Non Operating Income/Expense Non-Operating Interest income Equity in Afillates (Pretax) Interest Expense Interest Expense Growth Gross Interest Expense Inlerest Capitalized Pretax Income Prelax Income Growth Pretax Margin 160,338 156,778 3.28% 145,732 132,892 145,732 124,439 849B 2.27% Marketable Secuities Receivables Inventory Raw Materials Work In Progress Finished Goods Notes Receivable Other Current Assels Total Current Assets Property Plant&Equipment Accumulated Depreciation Net Properly Plant& Equipment Investment & Advances Other Non-Curreat Assets Deferred Charges 7.23B 20.44B 1122B 6.78B 3.24% 23,884 3.51% 53.29B 5221B 9.66% 3.93B -38.85% 113.59B 115.9B 65,19B 29.86B 35.33B 9.11% . 11,403 19,527 3618B 31.83B 36.61B 041B 11,403 56.18B 0.16% 10.97B 3,203 Deposits&Other Assets Total Assets Notes Payable Accounts Payable Current Portion Long-Term Dcbt Current Portion Capital Leases Accrued Expenses Income Taxes Payable Other Curent Liabilities Total Current Liabilities 7.93B 8.1B 256.54B 25781B 2,247 459 21.52B 23.28B 53.49B 51.62B 1,385 35 20.56B 19.7B 95.573 94.6B -46.67% 19.89% 2.71% ax 520 Income Tax Current Domestic Income Tax- Curent Foreign income Tax Deferred Domestic Income Tax Deferred Foreign Consolidated Net Income Minority Interest Expense Net Income Net Income Growth Net Margin Net Income After Extraordinaies Net Income Available to Common Convertible Debt 100.72B102.67B 868 Non-Curet Capital Leases Other Long-Term Liabilities Total Liabilittes Mi Preferred Stock Common Stock Net -901 23.59B 220.57B222.89B 3,695 26 65.40% 22.01B 22.67B 1.42B 41M 21.84B 21.22B 1.25B Retained Eanings Treasury Stock 7,602 Other Liabilities Shareholders Equity Total Liabilities & Shareholders Equity 7.33B 35.97B 256.54B257.81B 6.93B EPS (Basic) EPS (Basic) Growth Basic Shares Outstanding EPS (Diluted) EPS (Diluted) Growth Diluted Shsres Outstanding EBITDA EBITDA Growth EBITDA Margin EeIT 0.92 1.9 65.22% 3,975 1.9 65.45% 3,998 12,810 4.18% 34.92B -51.58% 0.00% 11,511 10.14% 7.18% 3,203 4,357