Answered step by step
Verified Expert Solution
Question
1 Approved Answer
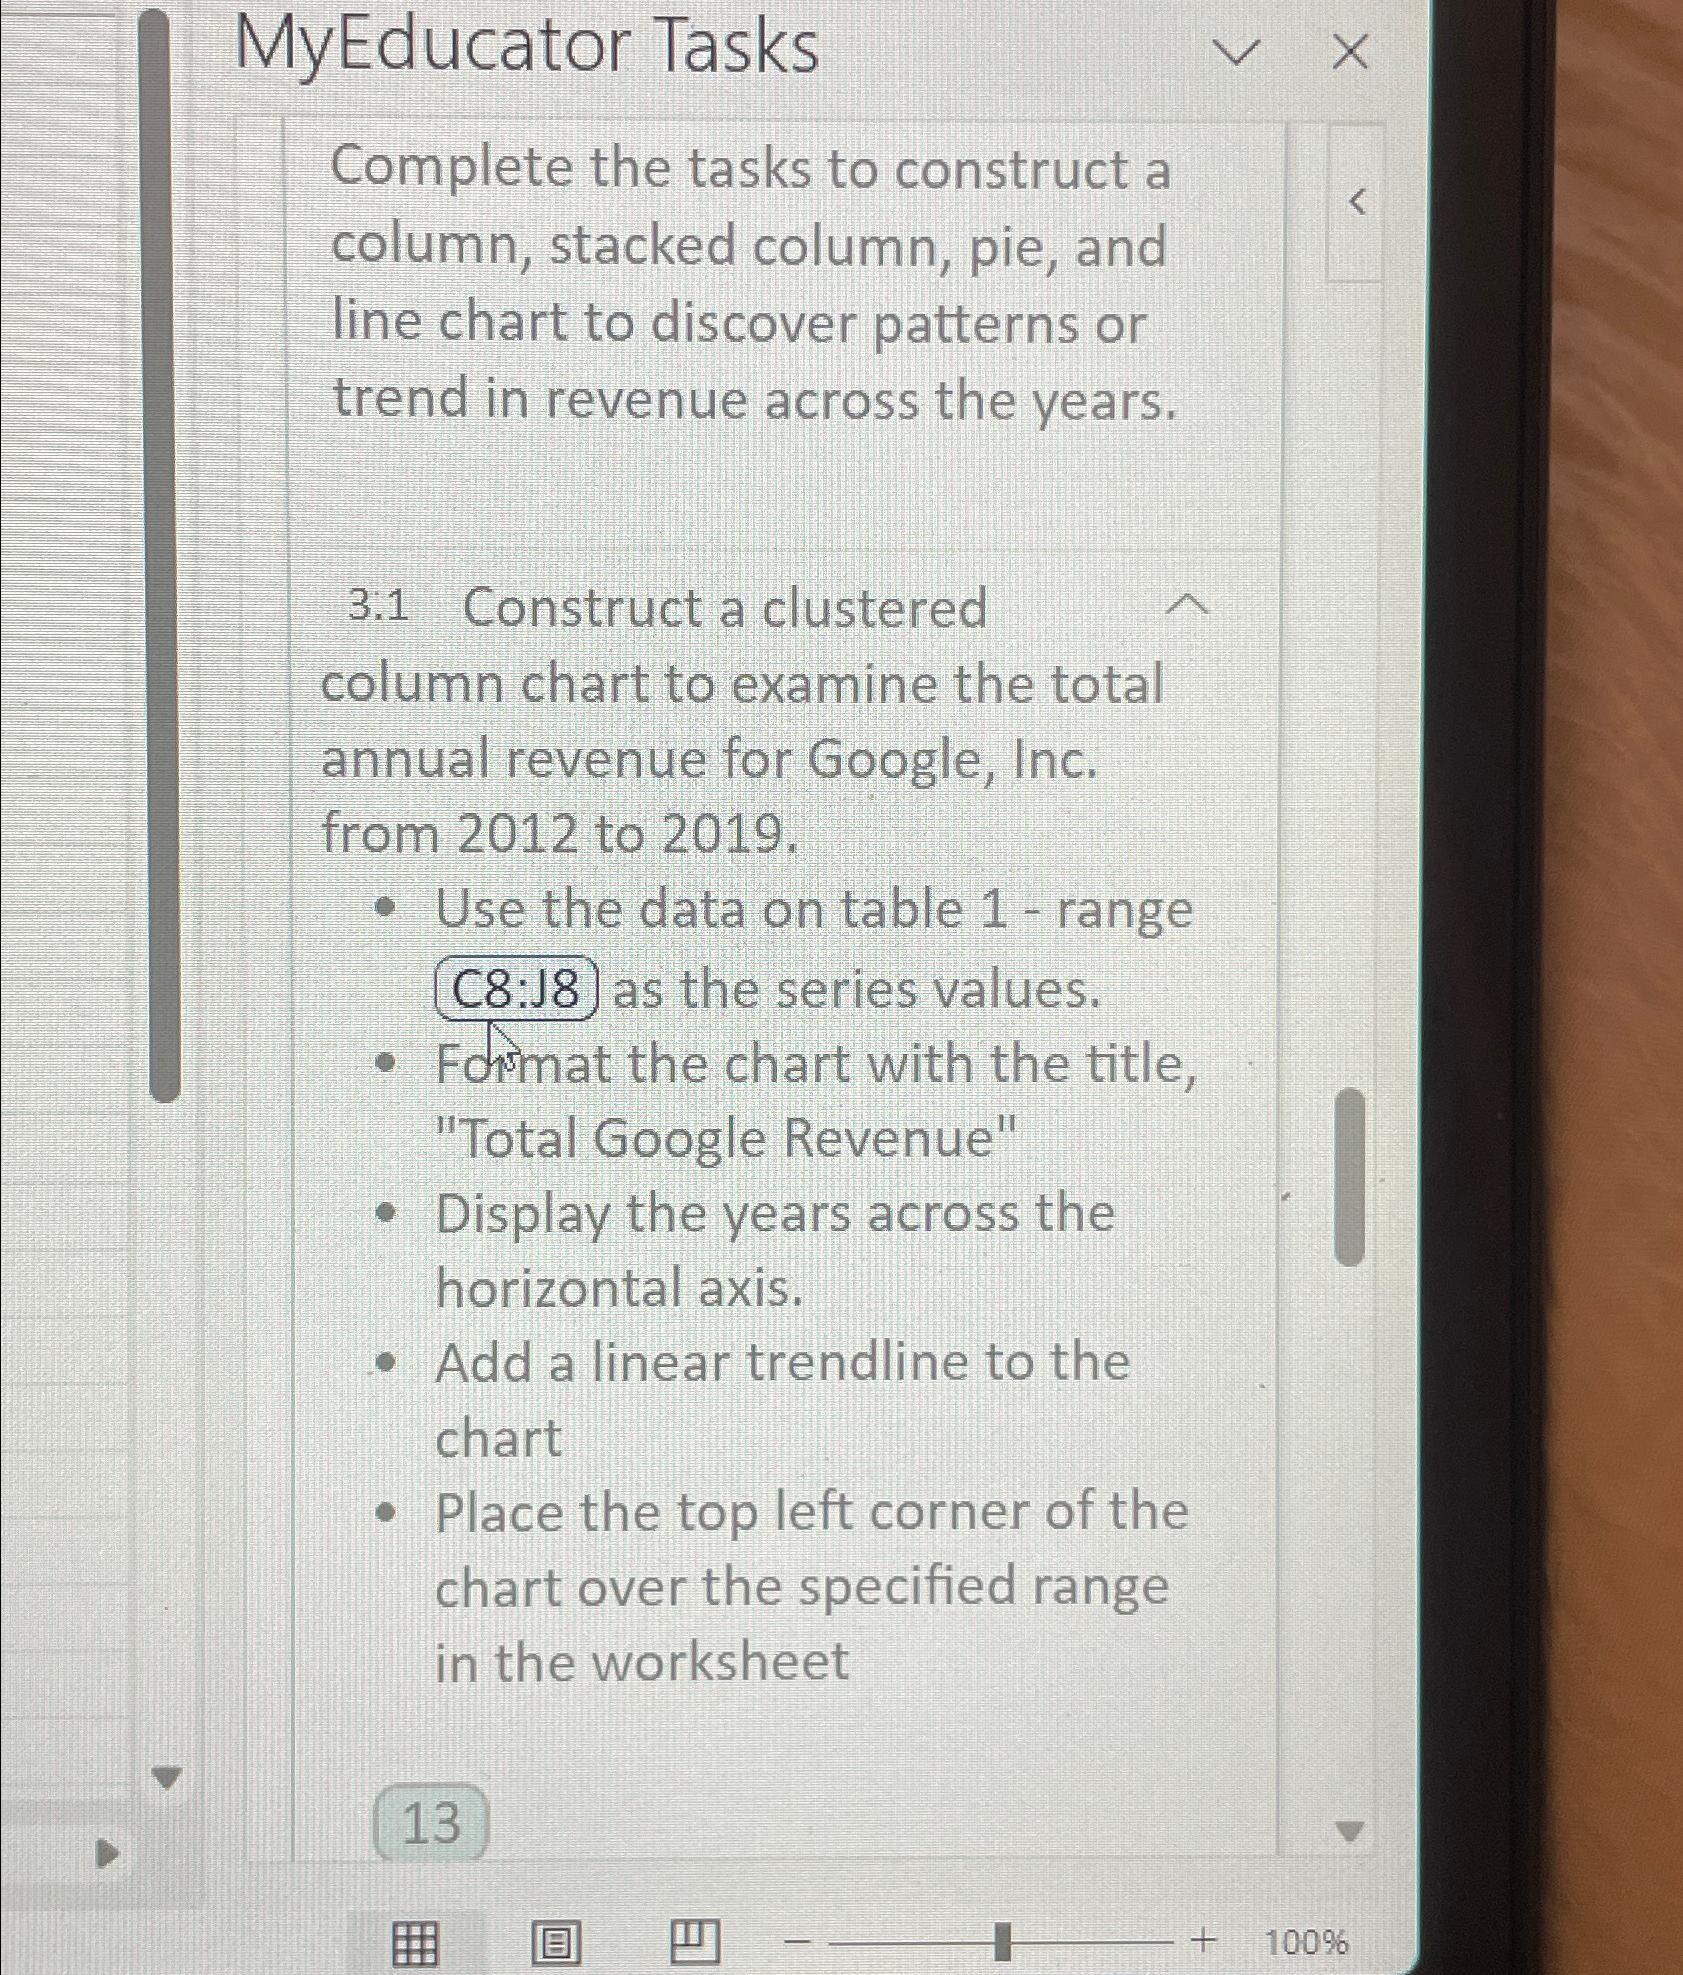
MyEducator Tasks Complete the tasks to construct a column, stacked column, pie, and line chart to discover patterns or trend in revenue across the years.
MyEducator Tasks
Complete the tasks to construct a column, stacked column, pie, and line chart to discover patterns or trend in revenue across the years.
Construct a clustered column chart to examine the total annual revenue for Google, Inc. from to
Use the data on table range C: as the series values.
Folmat the chart with the title, "Total Google Revenue"
Display the years across the horizontal axis.
Add a linear trendline to the chart
Place the top left corner of the chart over the specified range in the worksheet

Step by Step Solution
There are 3 Steps involved in it
Step: 1

Get Instant Access to Expert-Tailored Solutions
See step-by-step solutions with expert insights and AI powered tools for academic success
Step: 2

Step: 3

Ace Your Homework with AI
Get the answers you need in no time with our AI-driven, step-by-step assistance
Get Started


