myopenmathcom 2' 0 Question 6 v i a 0/5 pts '0 3 3 99 (D Details The mean age when smokers first start is 13
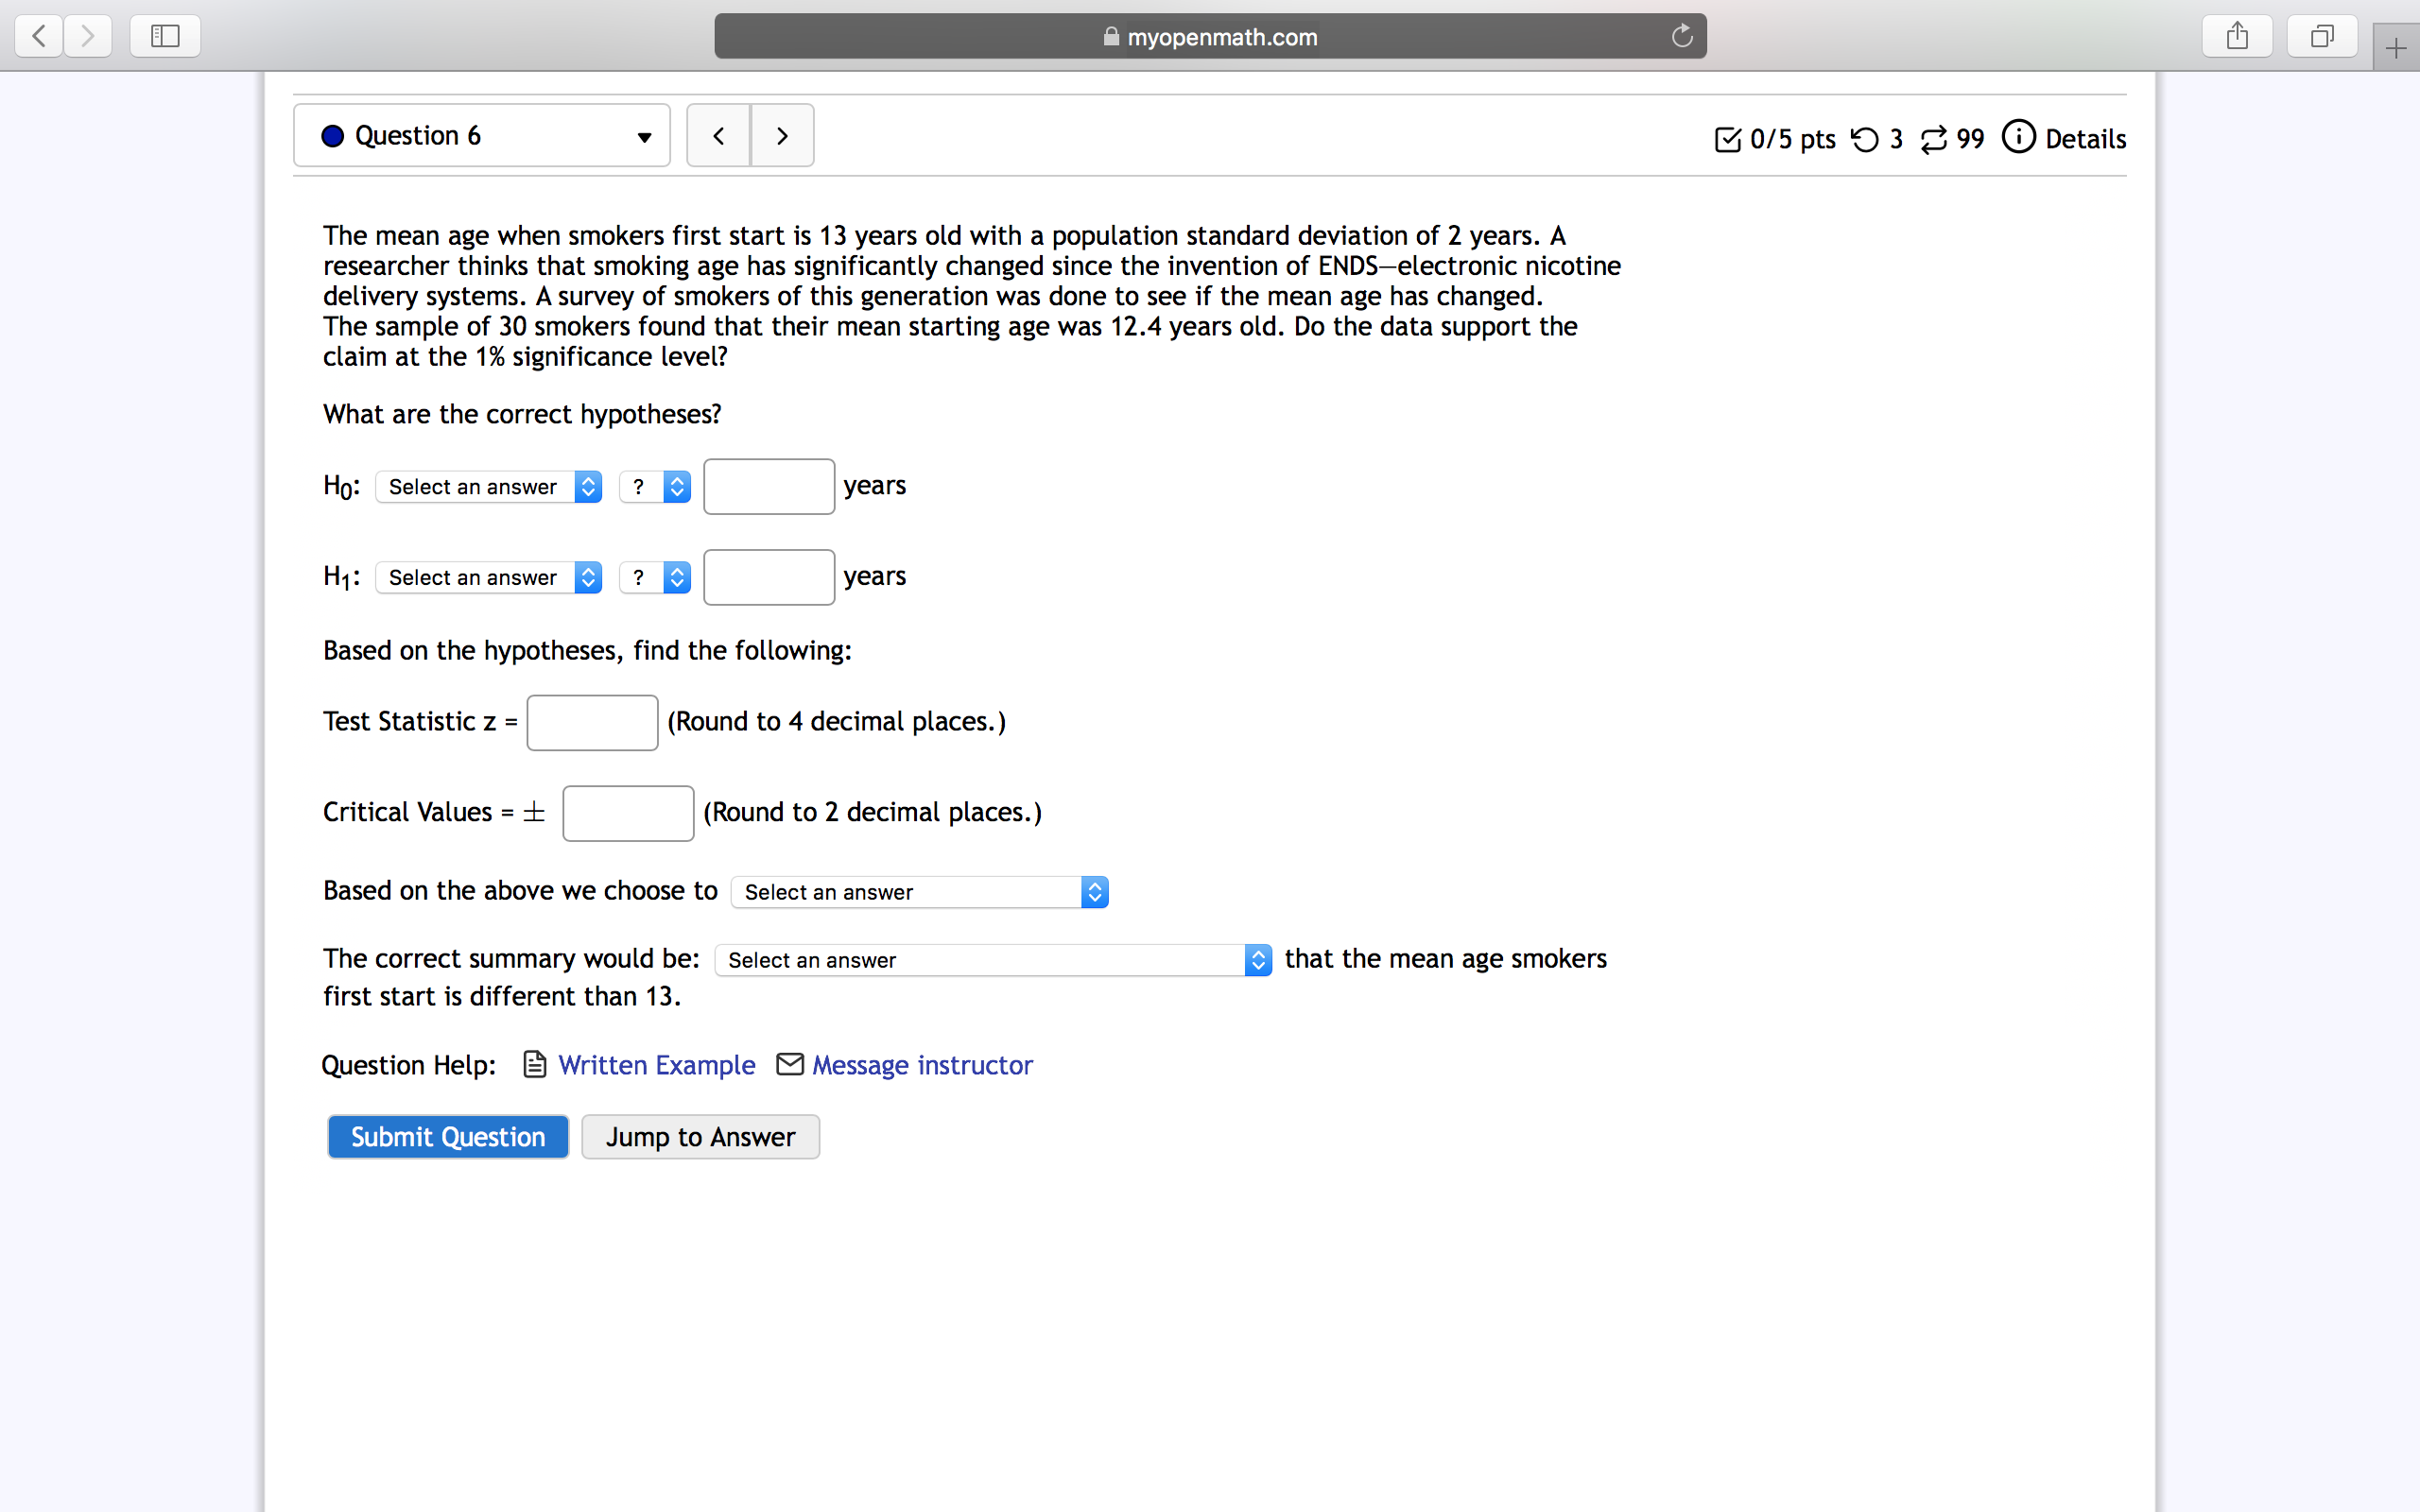
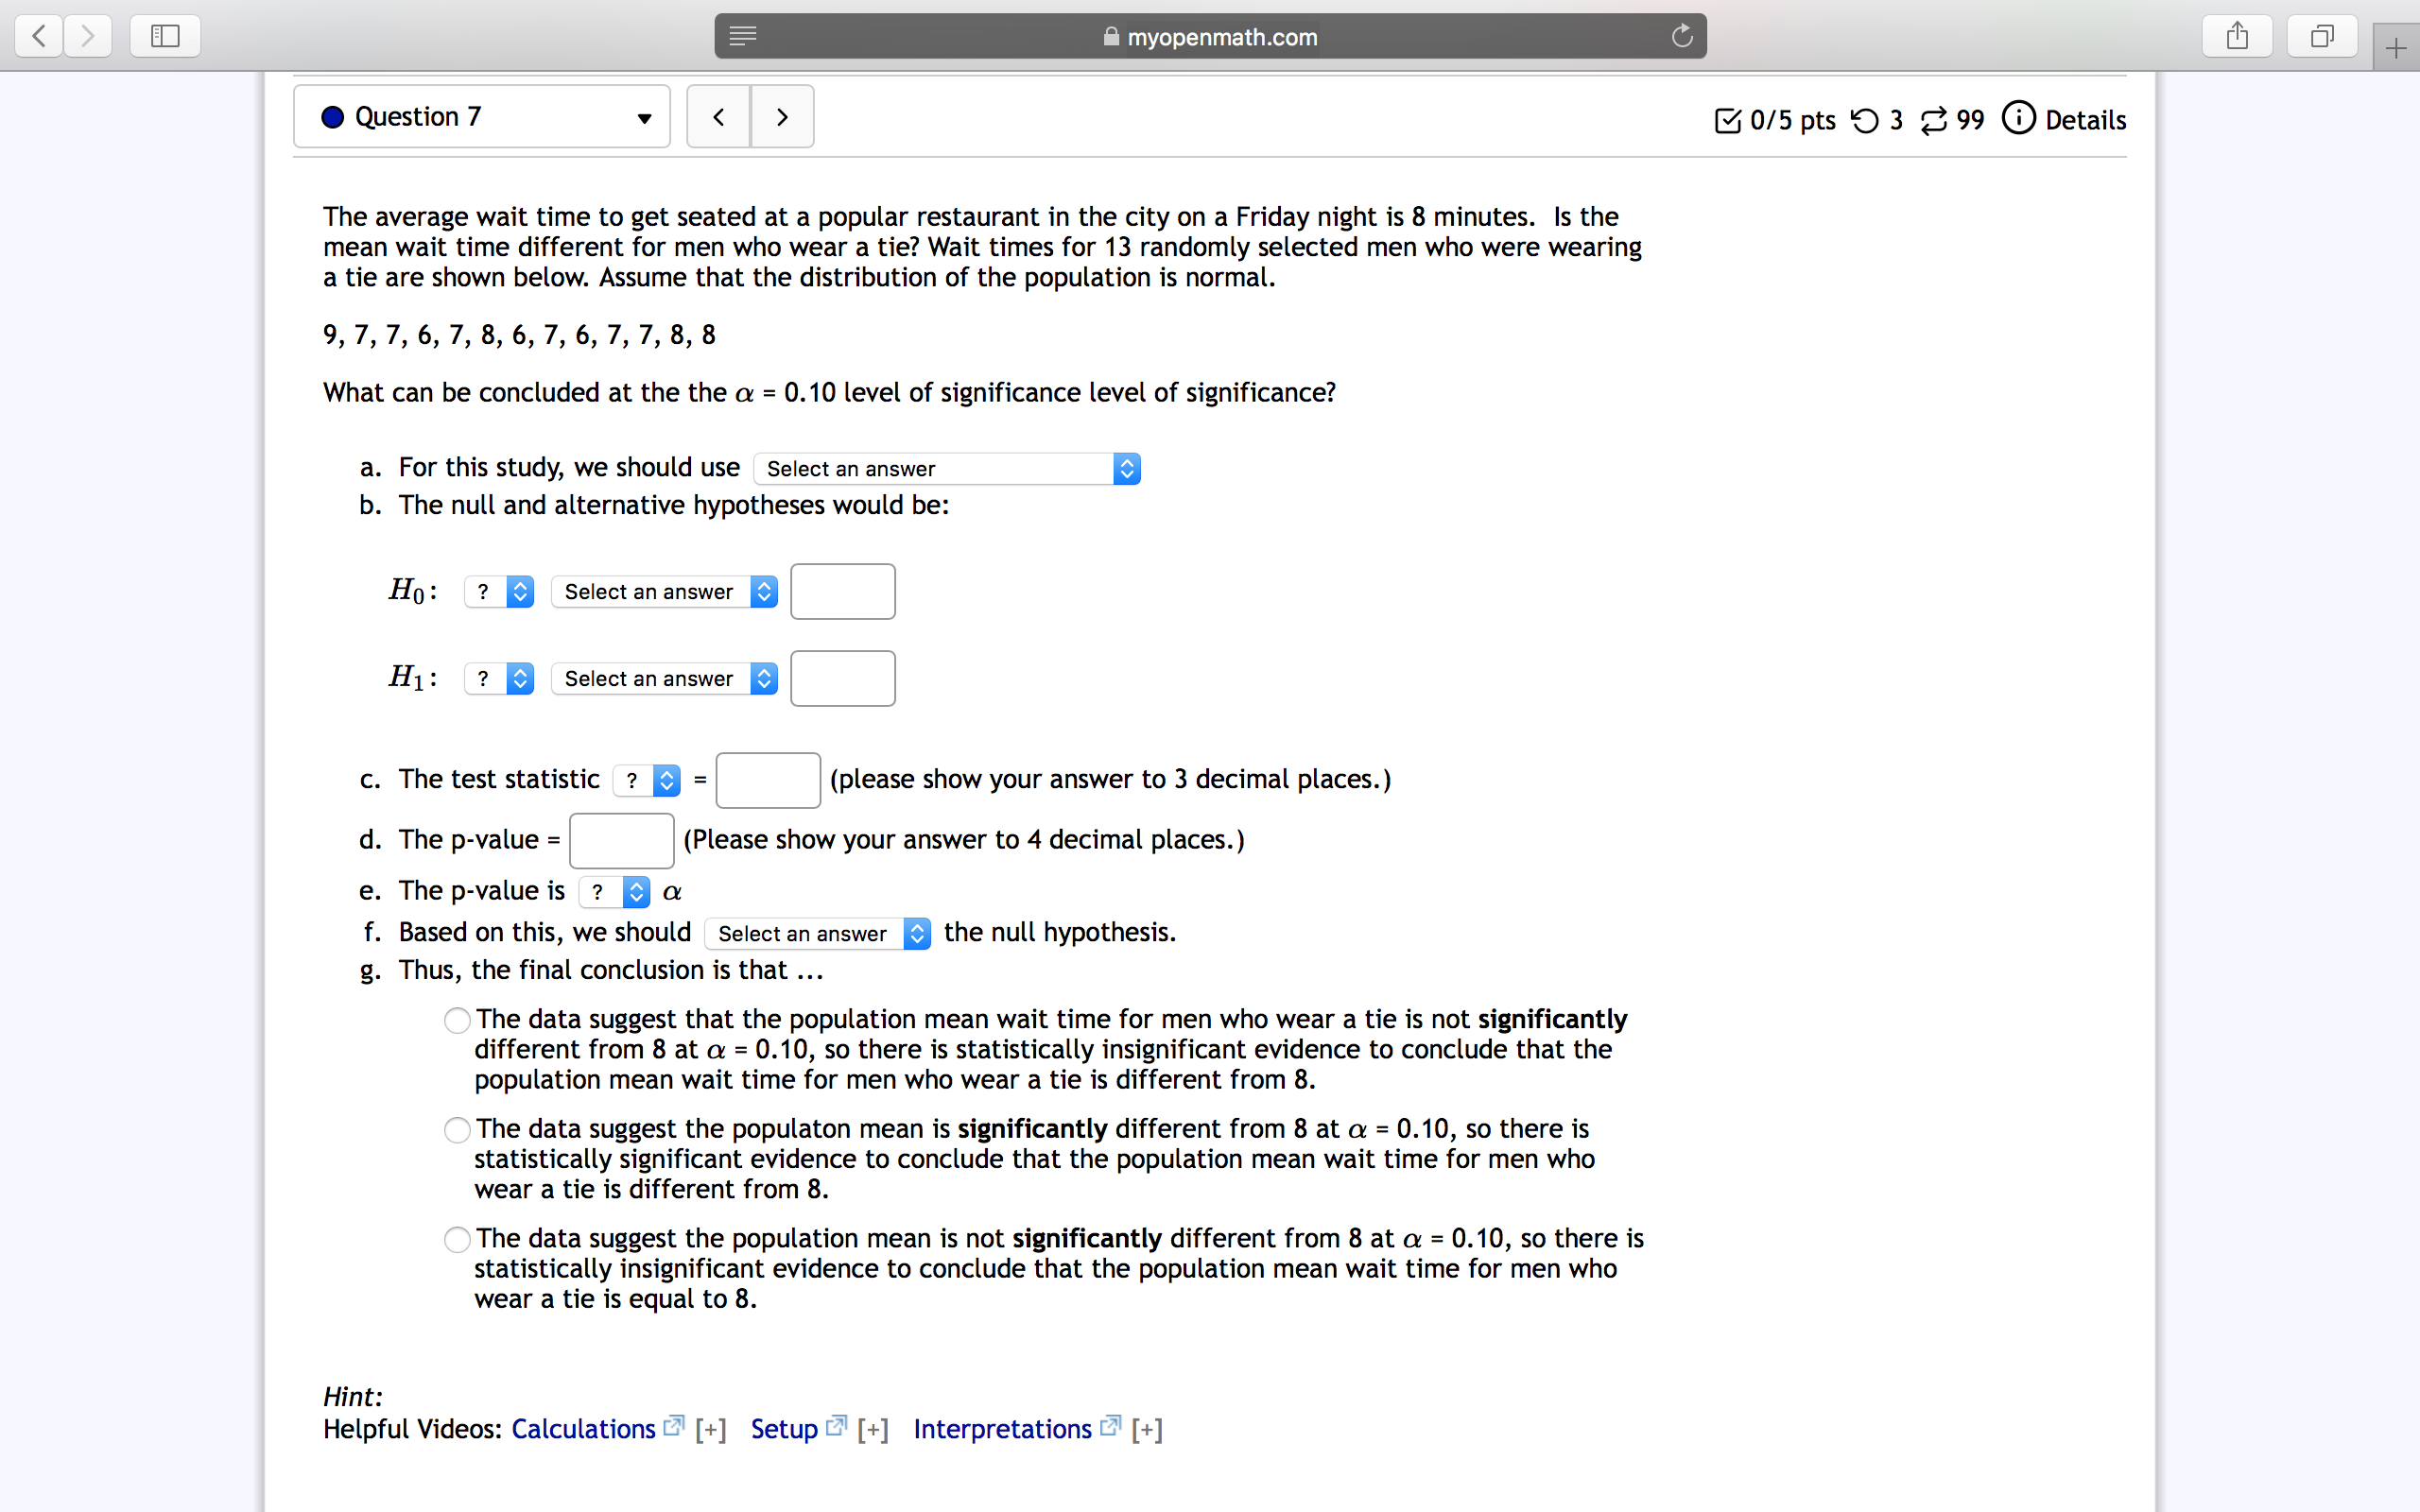
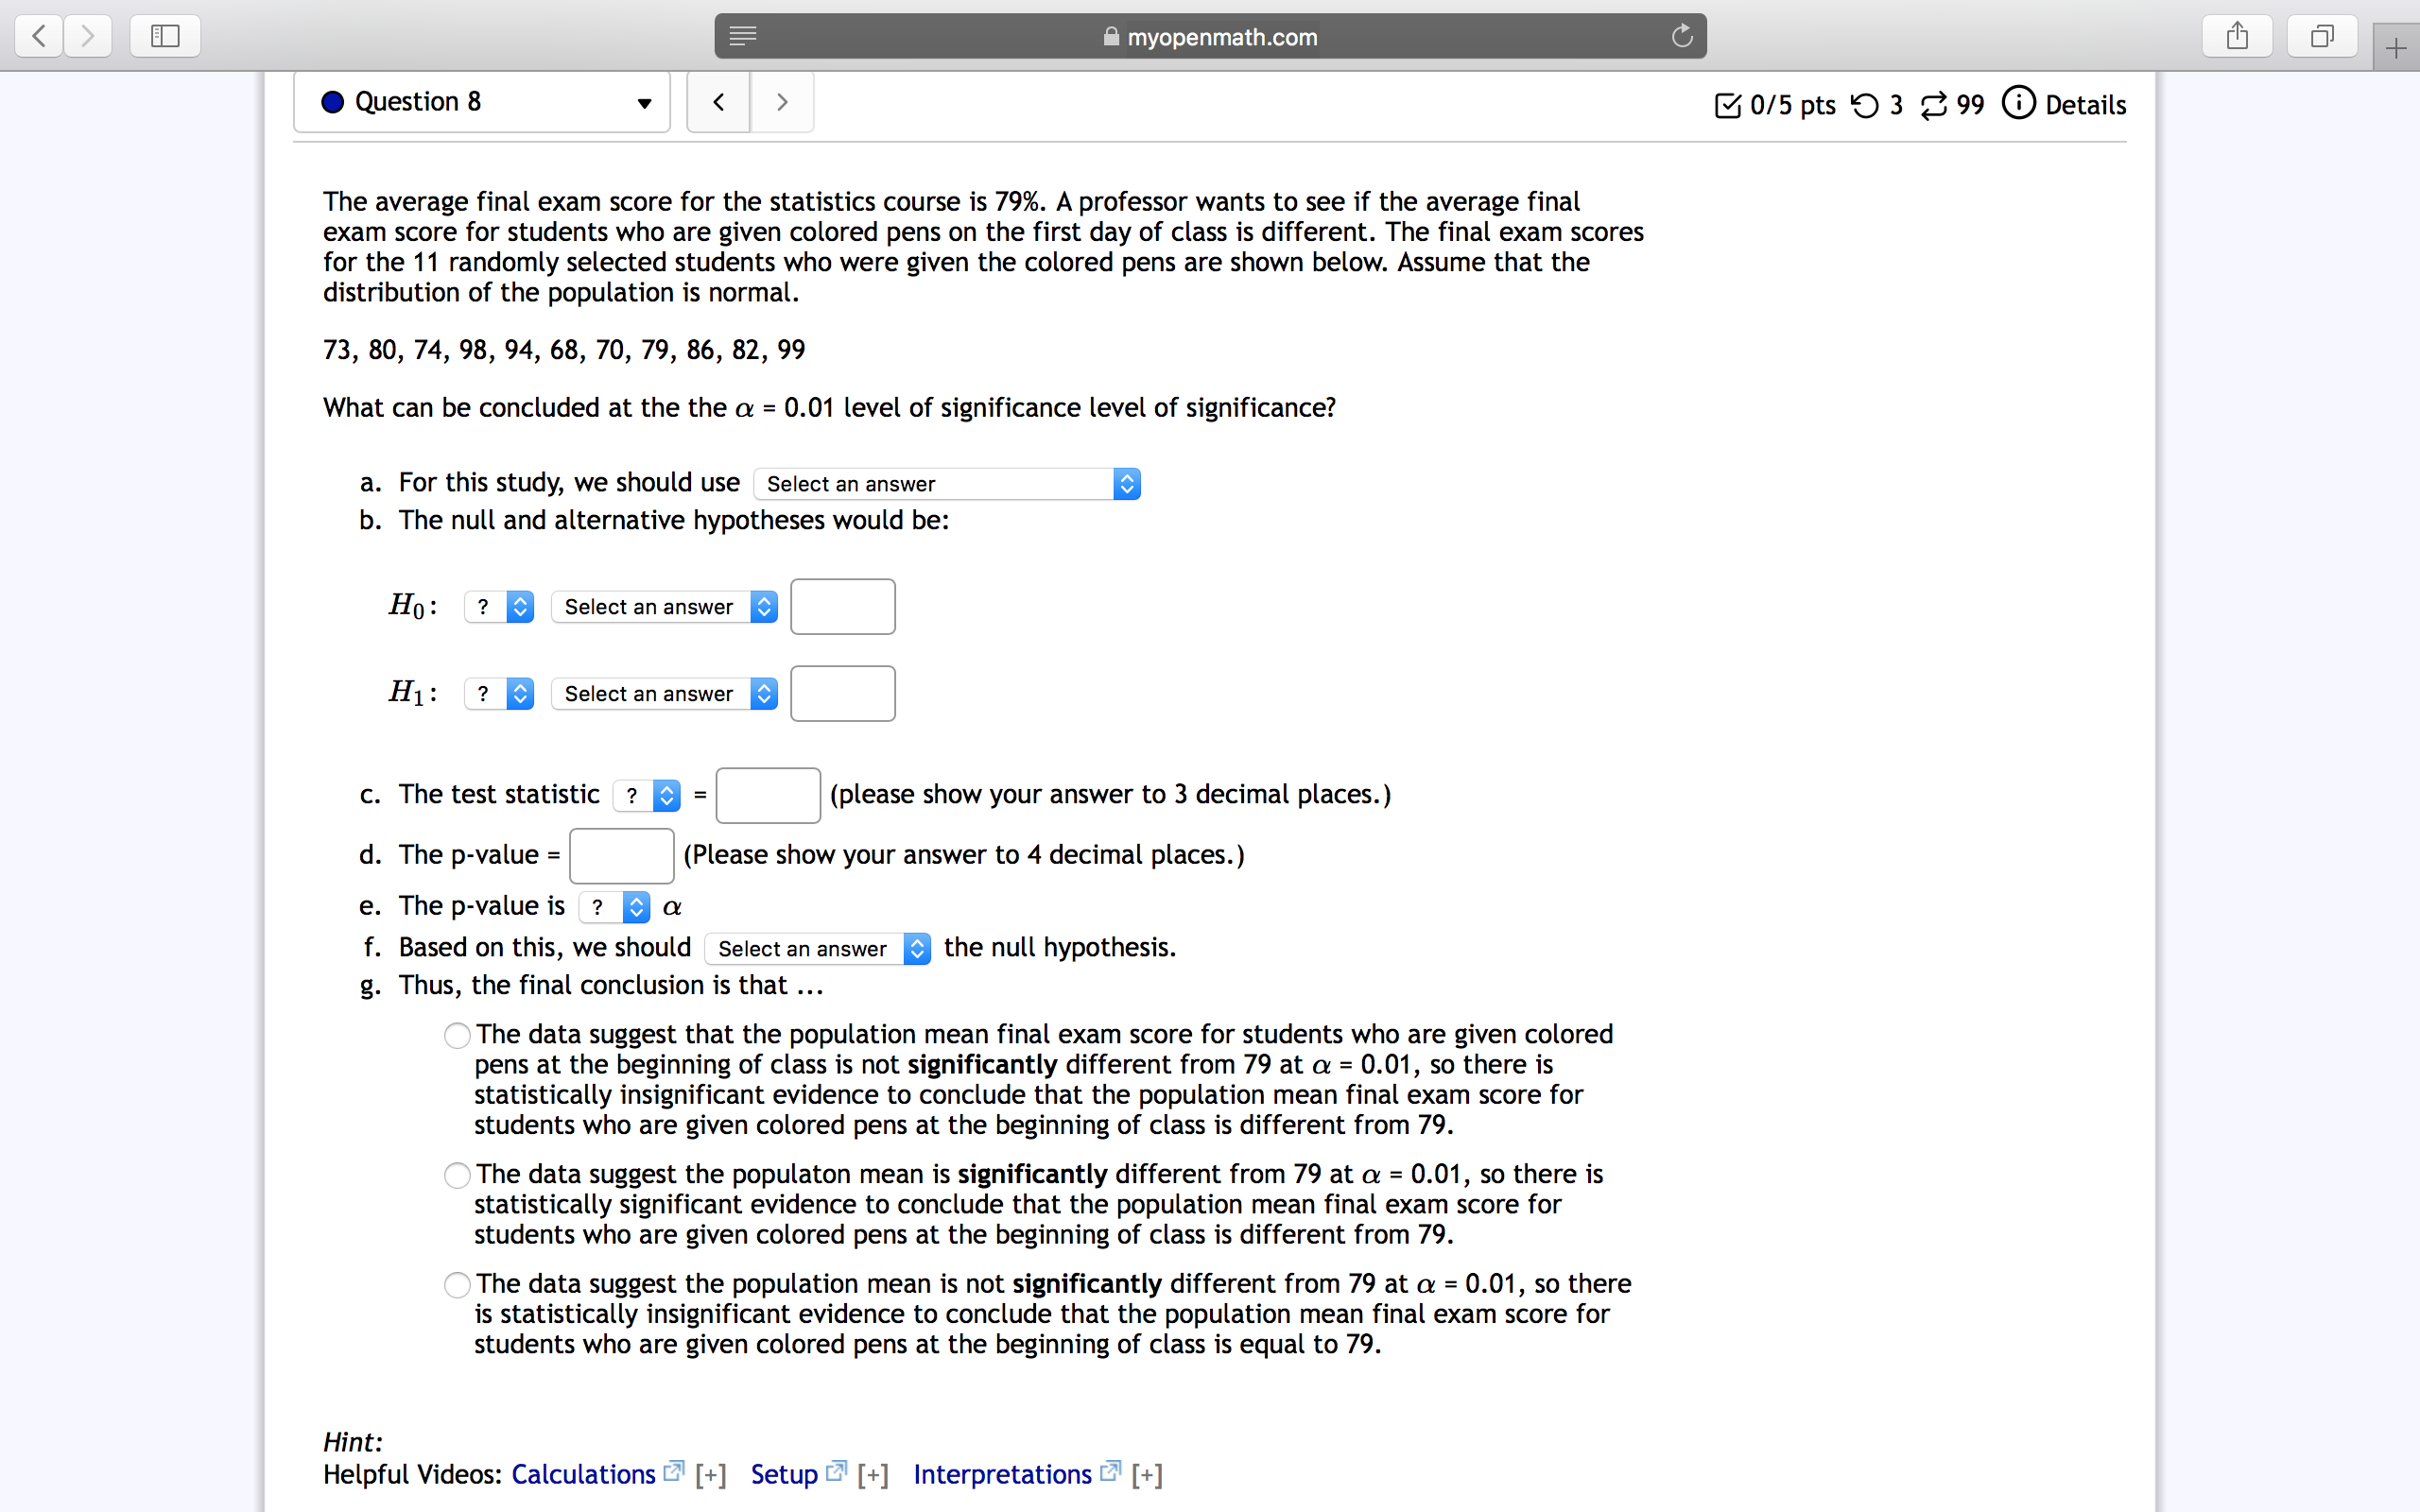
myopenmathcom 2' 0 Question 6 v i a 0/5 pts '0 3 3 99 (D Details The mean age when smokers first start is 13 years old with a population standard deviation of 2 years. A researcher thinks that smoking age has significantly changed since the invention of ENDSelectronic nicotine delivery systems. A survey of smokers of this generation was done to see if the mean age has changed. The sample of 30 smokers found that their mean starting age was 12.4 years old. Do the data support the claim at the 1% significance level? What are the correct hypotheses? Ho: Select an answer 77' [:years H1: Select an answer ? :Jyears Based on the hypotheses, find the following: Test Statistic z = [:] (Round to 4 decimal places.) Critical Values = :: [:] (Round to 2 decimal places.) Based on the above we choose to Select an answer a The correct summary would be: Select an answer that the mean age smokers first start is different than 13. Question Help: @ Written Example 8 Message instructor Submit Question l Jump to Answer l gi- i myopenmathcom , i iii 0 Question 7 v a 0/5 pts '0 3 3 99 G) Details The average wait time to get seated at a popular restaurant in the city on a Friday night is 8 minutes. Is the mean wait time different for men who wear a tie? Wait times for 13 randomly selected men who were wearing a tie are shown below. Assume that the distribution of the population is normal. 9, 7, 7, 6, 7, 8, 6, 7, 6, 7, 7, 8, 8 What can be concluded at the the a = 0.10 level of significance level of significance? a. For this study, we should use Select an answer b. The null and alternative hypotheses would be: H0: ? a Selectan answer a C] H1: ? a Selectan answer C] c. The test statistic ? = I: (please show your answer to 3 decimal places.) d. The p-value = [:] (Please show your answer to 4 decimal places.) e. The p-value is 187-0 f. Based on this, we should Select an answer a the null hypothesis. g. Thus, the final conclusion is that OThe data suggest that the population mean wait time for men who wear a tie is not significantly different from 8 at a = 0.10, so there is statistically insignificant evidence to conclude that the population mean wait time for men who wear a tie is different from 8. (\"The data suggest the populaton mean is significantly different from 8 at a = 0.10, so there is statistically significant evidence to conclude that the population mean wait time for men who wear a tie is different from 8. (\"The data suggest the population mean is not significantly different from 8 at a = 0.10, so there is statistically insignificant evidence to conclude that the population mean wait time for men who wear a tie is equal to 8. Hint: Helpful Videos: Calculations L7H [+] Setup 5' [+] Interpretations 5' [+] imyopenmathcom , l iii [71 - 0 Question 8 . l a 0/5 pts '0 3 8 99 (D Details The average final exam score for the statistics course is 79%. A professor wants to see if the average final exam score for students who are given colored pens on the first day of class is different. The final exam scores for the 11 randomly selected students who were given the colored pens are shown below. Assume that the distribution of the population is normal. 73, 80, 74, 98, 94, 68, 70, 79, 86, 82, 99 What can be concluded at the the a = 0.01 level of significance level of significance? a. For this study, we should use Select an answer a b. The null and alternative hypotheses would be: c. The test statistic ? a = C] (please show your answer to 3 decimal places.) d. The p-value = C] (Please show your answer to 4 decimal places.) e. The p-value is ? a f. Based on this, we should Select an answer the null hypothesis. g. Thus, the final conclusion is that (\"The data suggest that the population mean final exam score for students who are given colored pens at the beginning of class is not significantly different from 79 at a = 0.01, so there is statistically insignificant evidence to conclude that the population mean final exam score for students who are given colored pens at the beginning of class is different from 79. OThe data suggest the populaton mean is significantly different from 79 at a = 0.01 , so there is statistically significant evidence to conclude that the population mean final exam score for students who are given colored pens at the beginning of class is different from 79. OThe data suggest the population mean is not signicantly different from 79 at oz = 0.01, so there is statistically insignificant evidence to conclude that the population mean final exam score for students who are given colored pens at the beginning of class is equal to 79. Hint: Helpful Videos: Calculations FE' [+] Setup L\"? [+] Interpretations L\"? [+]
Step by Step Solution
There are 3 Steps involved in it
Step: 1
Get Instant Access to Expert-Tailored Solutions
See step-by-step solutions with expert insights and AI powered tools for academic success
Step: 2
Step: 3
Ace Your Homework with AI
Get the answers you need in no time with our AI-driven, step-by-step assistance