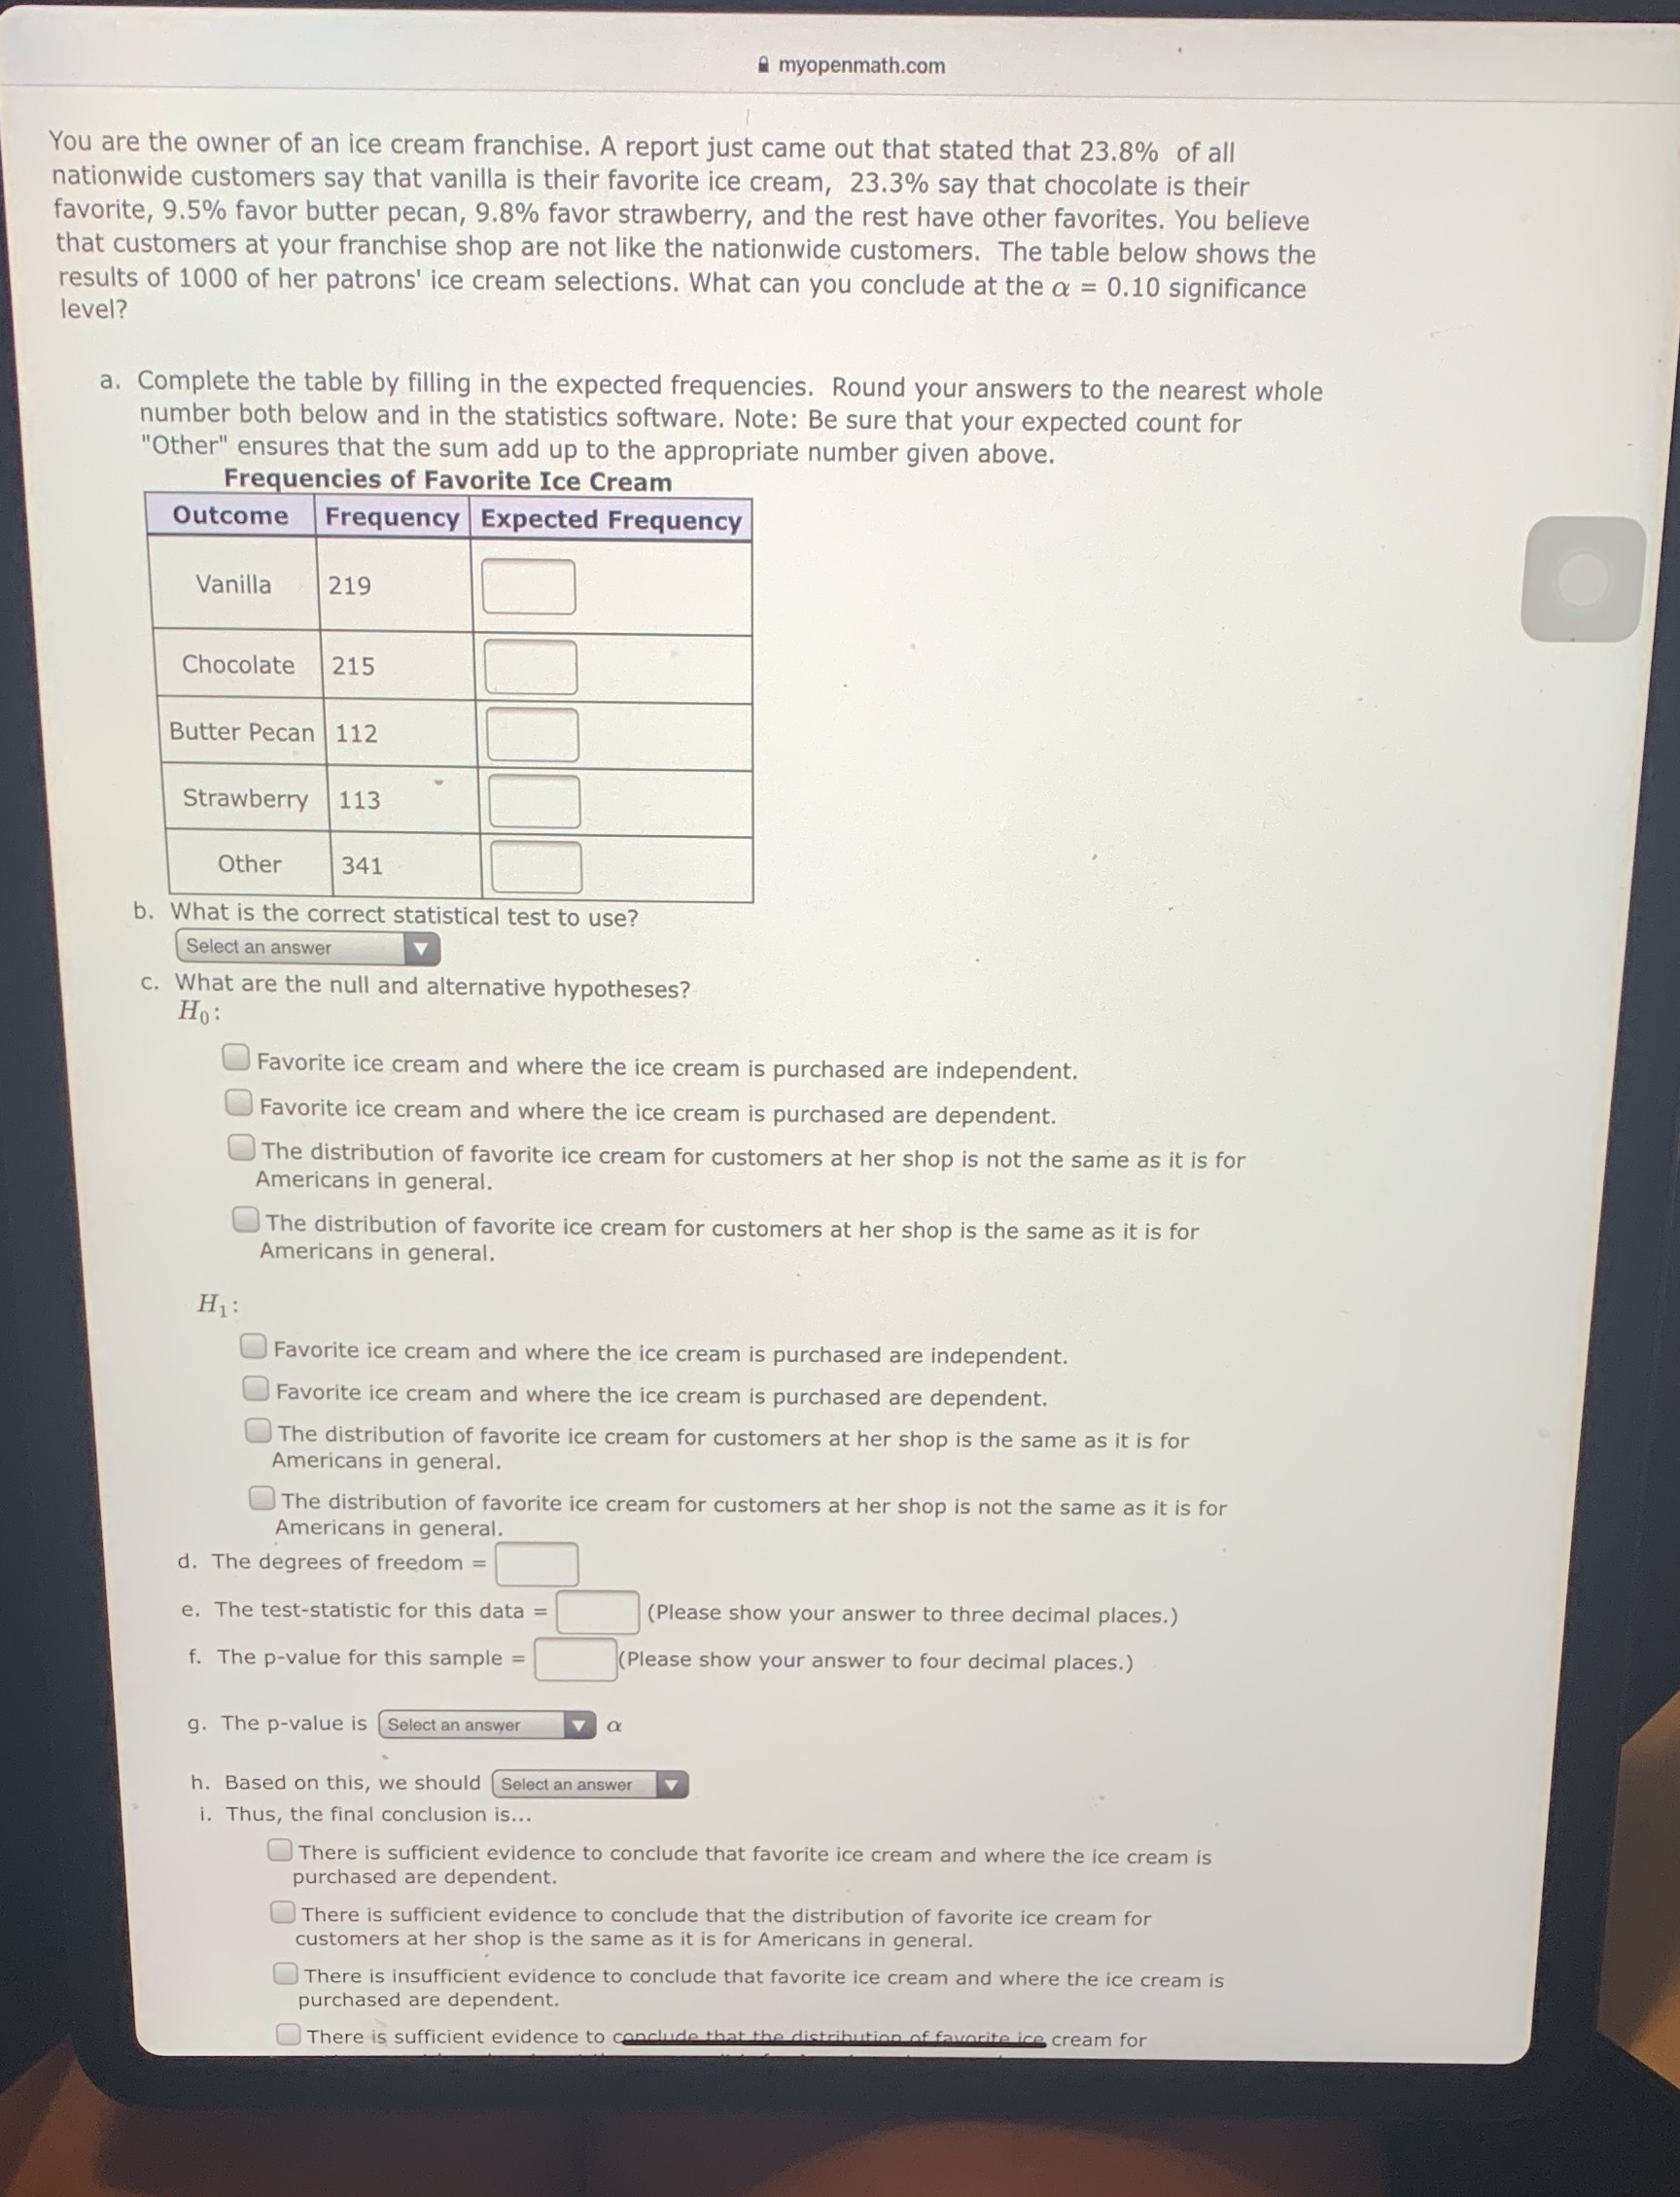
myopenmath.com You are the owner of an ice cream franchise. A report just came out that stated that 23.8% of all nationwide customers say that vanilla is their favorite ice cream, 23.3% say that chocolate is their favorite, 9.5% favor butter pecan, 9.8% favor strawberry, and the rest have other favorites. You believe that customers at your franchise shop are not like the nationwide customers. The table below shows the results of 1000 of her patrons' ice cream selections. What can you conclude at the a = 0.10 significance level? a. Complete the table by filling in the expected frequencies. Round your answers to the nearest whole number both below and in the statistics software. Note: Be sure that your expected count for 'Other" ensures that the sum add up to the appropriate number given above. Frequencies of Favorite Ice Cream Outcome Frequency Expected Frequency Vanilla 219 Chocolate 215 Butter Pecan 112 Strawberry 113 Other 341 b. What is the correct statistical test to use? Select an answer Y c. What are the null and alternative hypotheses? Ho: Favorite ice cream and where the ice cream is purchased are independent. Favorite ice cream and where the ice cream is purchased are dependent. The distribution of favorite ice cream for customers at her shop is not the same as it is for Americans in general. The distribution of favorite ice cream for customers at her shop is the same as it is for Americans in general. H1 : OFavorite ice cream and where the ice cream is purchased are independent. Favorite ice cream and where the ice cream is purchased are dependent. The distribution of favorite ice cream for customers at her shop is the same as it is for Americans in general. The distribution of favorite ice cream for customers at her shop is not the same as it is for Americans in general. d. The degrees of freedom = e. The test-statistic for this data = (Please show your answer to three decimal places.) f. The p-value for this sample = (Please show your answer to four decimal places.) g. The p-value is Select an answer h. Based on this, we should Select an answer i. Thus, the final conclusion is... There is sufficient evidence to conclude that favorite ice cream and where the ice cream is purchased are dependent. There is sufficient evidence to conclude that the distribution of favorite ice cream for customers at her shop is the same as it is for Americans in general. There is insufficient evidence to conclude that favorite ice cream and where the ice cream is purchased are dependent. There is sufficient evidence to conclude that the distribution of favorite ice cream for


