Answered step by step
Verified Expert Solution
Link Copied!

Question

1 Approved Answer

n 1 2 3 4 01 0.64 0.14 0.39 0.06 22 0.28 0.47 0.34 0.45 93 0.080.39 0.27 0.49 The table shows the predictions for
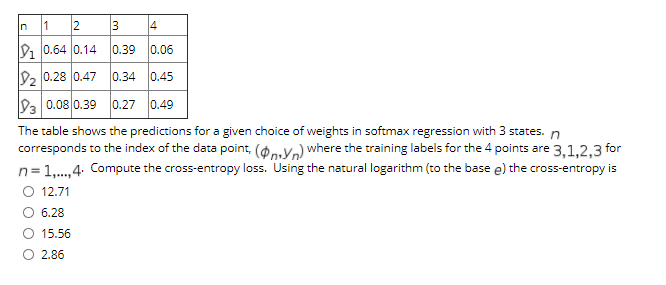
image text in transcribed

n 1 2 3 4 01 0.64 0.14 0.39 0.06 22 0.28 0.47 0.34 0.45 93 0.080.39 0.27 0.49 The table shows the predictions for a given choice of weights in softmax regression with 3 states. n corresponds to the index of the data point, (0 n. Yn) where the training labels for the 4 points are 3,1,2,3 for n=1,...,4. Compute the cross-entropy loss. Using the natural logarithm (to the base e) the cross-entropy is 12.71 6.28 15.56 2.86

Step by Step Solution

There are 3 Steps involved in it

Step: 1

blur-text-image

Get Instant Access to Expert-Tailored Solutions

See step-by-step solutions with expert insights and AI powered tools for academic success

Step: 2

blur-text-image

Step: 3

blur-text-image

Ace Your Homework with AI

Get the answers you need in no time with our AI-driven, step-by-step assistance

Get Started

Recommended Textbook for

Relational Database And Transact SQL

Authors: Lucy Scott

1st Edition

1974679985, 978-1974679980

More Books

Students also viewed these Databases questions

Question

=+derived from the assignment will balance the costs?

Answered: 1 week ago

Question

=+6 Who is the peer of the IA ?

Answered: 1 week ago