Answered step by step
Verified Expert Solution
Question
1 Approved Answer
PART B We want to predict the selling price of a house in Newburg Park, Florida, based on the distance the house lies from the
 PART B

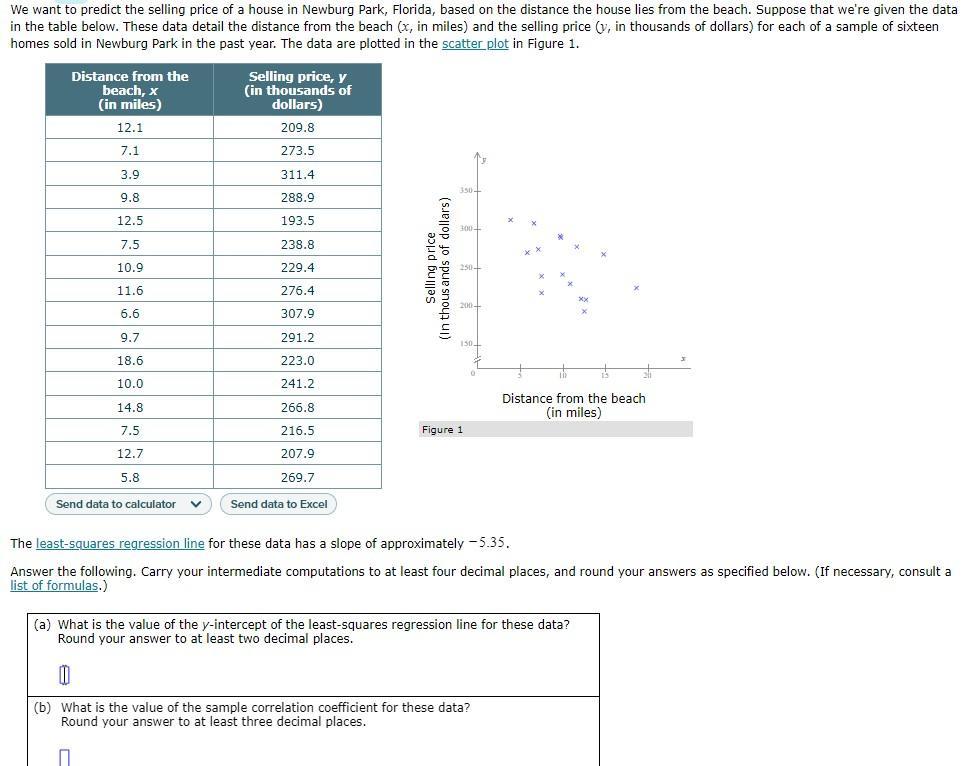
We want to predict the selling price of a house in Newburg Park, Florida, based on the distance the house lies from the beach. Suppose that we're given the data in the table below. These data detail the distance from the beach (x, in miles) and the selling price (y, in thousands of dollars) for each of a sample of sixteen homes sold in Newburg Park in the past year. The data are plotted in the scatter plot in Figure 1. Distance from the beach, x (in miles) 12.1 7.1 3.9 9.8 12.5 7.5 10.9 11.6 6.6 9.7 18.6 10.0 Selling price, y (in thousands of dollars) 209.8 273.5 311.4 288.9 193.5 238.8 229.4 276.4 307.9 291.2 223.0 241.2 266.8 216.5 207.9 269.7 Send data to calculator v Send data to Excel 14.8 7.5 12.7 5.8 Selling price (In thousands of dollars) Figure 1 Distance from the beach (in miles) The least-squares regression line for these data has a slope of approximately -5.35. Answer the following. Carry your intermediate computations to at least four decimal places, and round your answers as specified below. (If necessary, consult a list of formulas.) (a) What is the value of the y-intercept of the least-squares regression line for these data? Round your answer to at least two decimal places. (b) What is the value of the sample correlation coefficient for these data? Round your answer to at least three decimal places.
Step by Step Solution
★★★★★
3.56 Rating (177 Votes )
There are 3 Steps involved in it
Step: 1

Get Instant Access to Expert-Tailored Solutions
See step-by-step solutions with expert insights and AI powered tools for academic success
Step: 2

Step: 3

Ace Your Homework with AI
Get the answers you need in no time with our AI-driven, step-by-step assistance
Get Started


