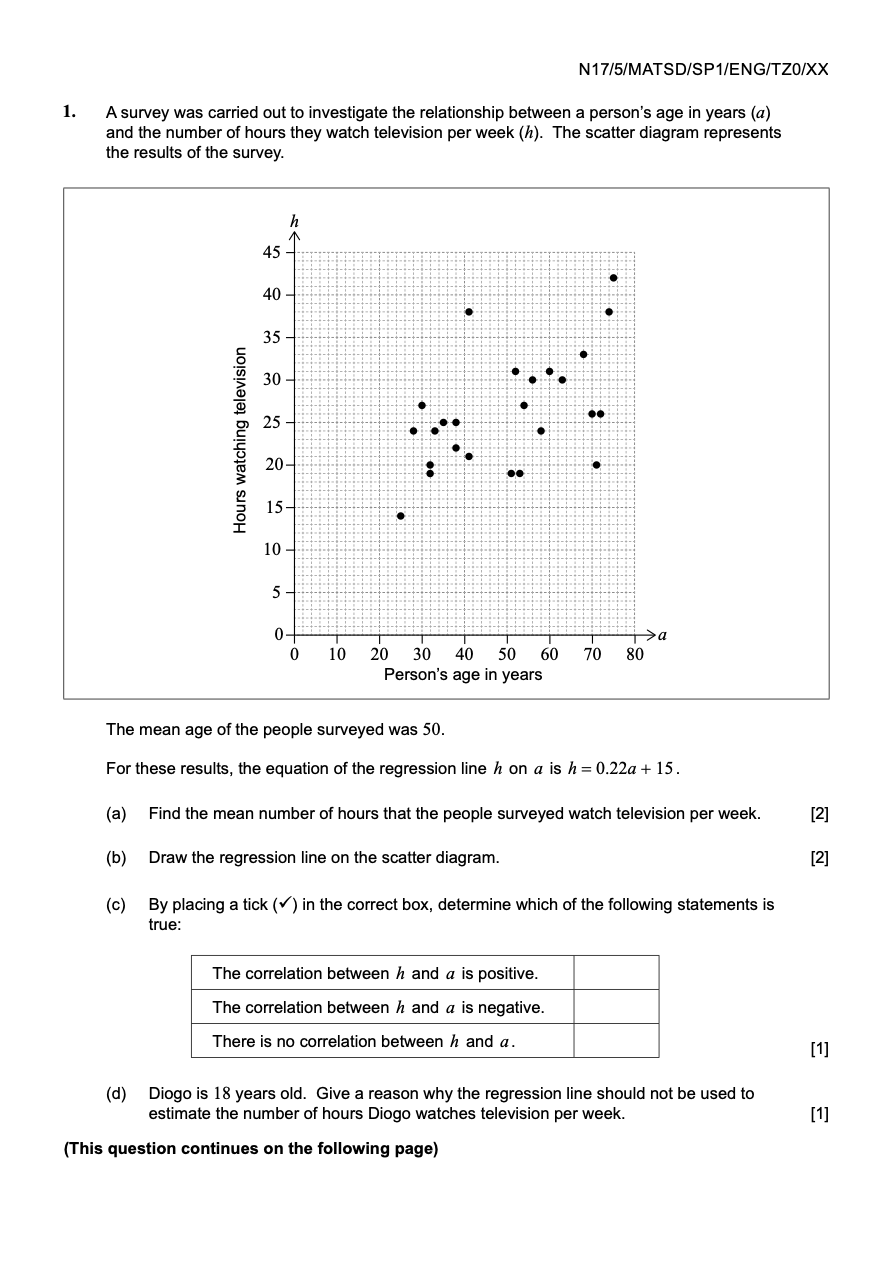
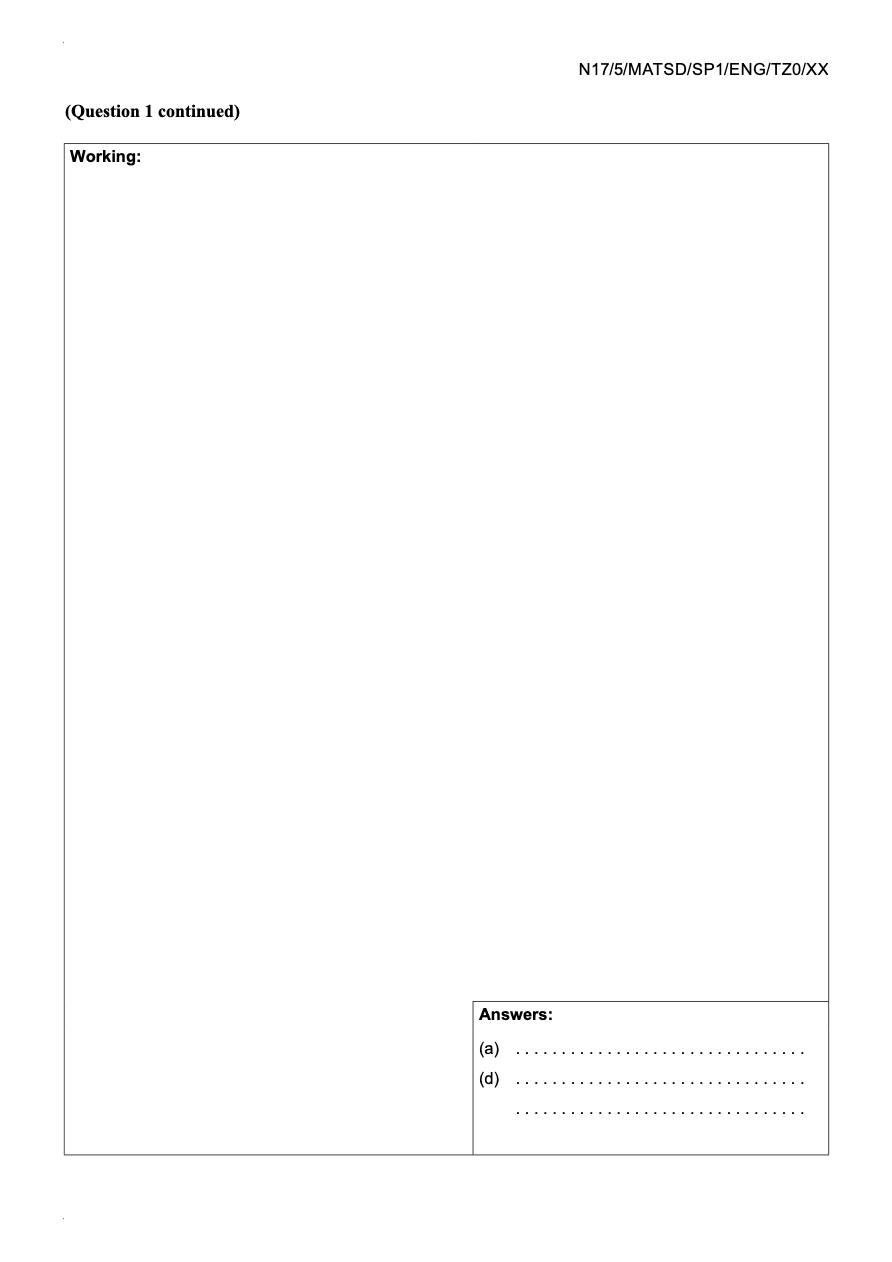
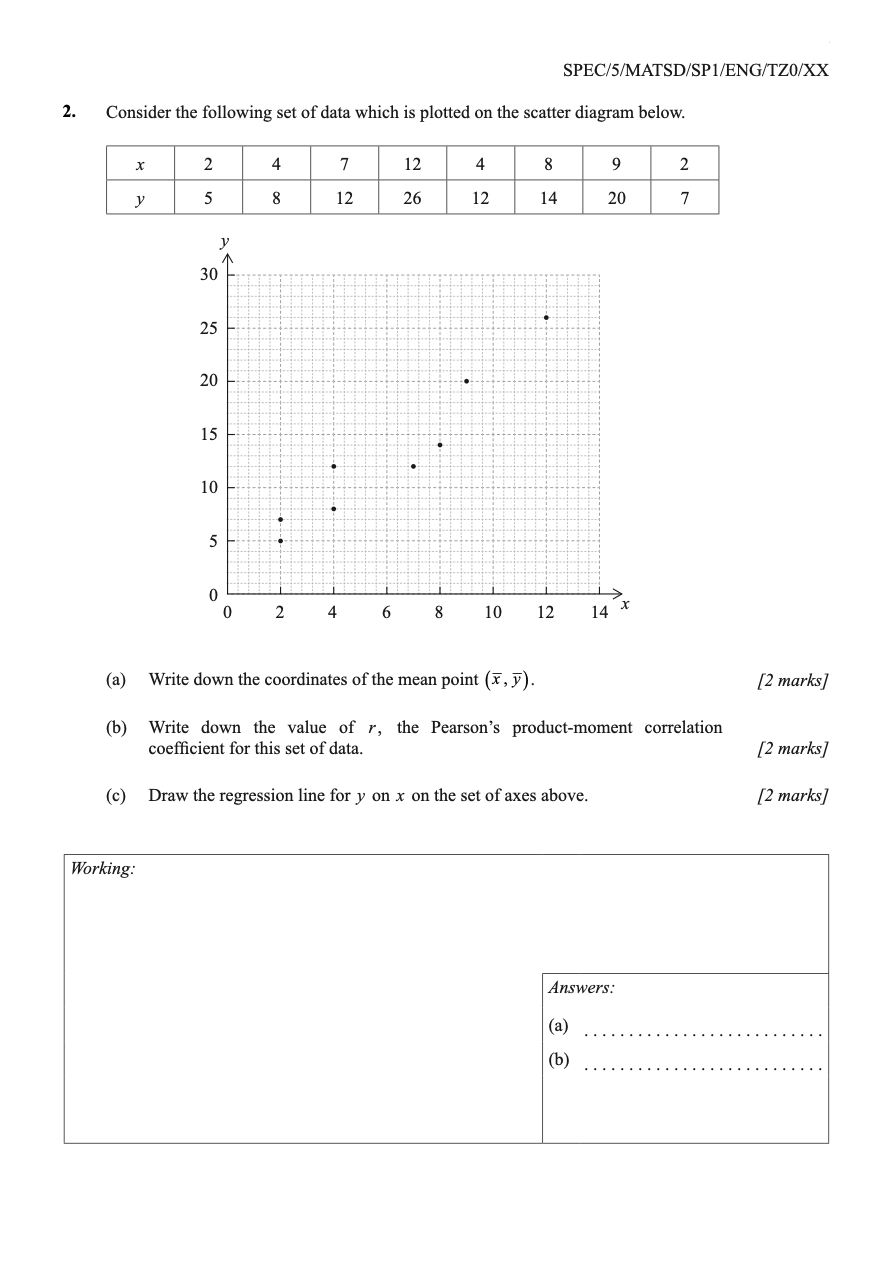
N1 NSIMATSDIS P1IENGFI'ZDIXX l. A survey was carried out to investigate the relationship between a person's age in years (a) and the number of hours they watch television per week (It). The scatter diagram represents the results of the survey. N on J c 2 2 E E 3 J: 3 cc 3 E 3 o I 1t} 20 3t} 40 5t} 60 T0 30 Person's age in years The mean age of the people surveyed was 50. For these results, the equation of the regression line i: on a is h = 0.22:: + 15. (a) Find the mean number of hours that the people surveyed watch television per week. [2] (b) Draw the regression line on the scatter diagram. [2] (c) By placing a tick (f) in the correct box. determine which of the following statements is the: The correlation between I: and a is positive. The correlation between i: and a is negative. There is no correlation between I: and a. [1] (d) Bingo is 18 years old. Give a reason why the regression line should not be used to estimate the number of hours Diogo watches television per week. [1] (T his question continues on the following page) \fSPECHSMATSDHSPUENGJ'TZOKX 2. Consider the following set of data which is plotted on the scatter diagram below. 024631012141 (a) Write down the coordinates of the mean point (i, . [2 marks} (h) Write down the value of r, the Pearson's product-moment correlation coefficient for this set of data. [2 marks} (c) Draw the regression line for y on x on the set of axes above. [2 marks] M16/5/MATSD/SP2/ENG/TZ1/XX 3. [Maximum mark: 12] For an ecological study, Ernesto measured the average concentration (y) of the fine dust, PM10, in the air at different distances (x) from a power plant. His data are represented on the following scatter diagram. The concentration of PM10 is measured in micrograms per cubic metre and the distance is measured in kilometres. YA 140 120 10 80 Concentration of PM10 (ugm ) 60 40 20 2 4 8 10 12 distance (km) (This question continues on the following page){Question 3 continued} His data are also listed in the following table. M1615!MATSDISP2IENGITZ1DO( Distance (1] 0.6 1 .2 2.6 a Concentration of 123 115 103 89 PHll] (y) 5.5 92 6.2 30 7.5 7'2 8.6 10.5 12.2 62 (a) Use the scatter diagram to nd the value of a and of b in the table. (1:) Calculate (i) E . the mean distance from the power plant; (ii) i. the mean concentration of PMIO; (iii) r, the Pearson's productmoment correlation coefcient. to) Write down the equation of the regression line y on x. Emesto's school is located 14km from the power plant. He uses the equation of the regression line to estimate the concentration of PMlO in the air at his school. (d) (i) Calculate the value of Emesto's estimate. (ii) State whether Emesto's estimate is reliable. Justify your answer. [2] l4] [2] l4] N1 BISIMATSDISPZIENGITZDM [Maximum mark: 17] In the month before their ID Diploma examinations, eight male students recorded the number of hours they spent on social media. For each student, the number of hours spent on social media (1) and the number of IE Diploma points obtained (y) are shown in the following table. an IB Diploma points (y) 43 (a) On graph paper, draw a scatter diagram for these data. Use a scale of 2cm to represent 5 hours on the xaxis and 2cm to represent It} points on the yaxis. (b) Use your graphic display calculator to nd (i) f. the mean number of hours spent on social media; (ii) i. the mean number of IE Diploma points. (c) Plot the point (I , 57} on your scatter diagram and label this point M. (d) Write down the value of r, the Pearson's productmoment correlation coefcient, for these data. (e) Write down the equation of the regression line y on x for these eight male students. if} Draw the regression line. from part (e), on your scatter diagram. Ten female students also recorded the number of hours they spent on social media in the month before their IB Diploma examinations. Each of these female students spent between 3 and 30 hours on social media. The equation of the regression line y on x for these ten female students is 2 125 y=-x+ 3 3 ' An eleventh girl spent 34 hours on social media in the month before her IB Diploma examinations. (9} Use the given equation of the regression line to estimate the number of IE Diploma points that this girl obtained. (h) Write down a reason why this estimate is not reliable. l4] l2] l2] l2] l2] l2] l2] l1] M17I5fMATSDISP2fENGITZ1M 5. [Maximum mark: 14] The following table shows the average body weight, 2: , and the average weight of the brain. y. of seven species of mammal. Both measured in kilograms (kg). Species :'grmirxb Amongrzlxalghtor 3 0.025 455 0.423 137 0.419 529 0.530 23 0.115 100 0.157 55 0.175 (E) Find the range of the average My ill[Eights for these seven species of mammal. [2] (b) For the data from these seven species (i) calculate r, the Pearson's productmoment correlation coefcient; (ii) describe the correlation between the average body weight and the average weight of the brain. [4] (c) Write down the equation of the regression line y on x, in the form y = mx + c. [2] The average body weight of grey wolves is 36kg. (d) Use your regression line to estimate the average weight of the brain of grey wolves. [2] In fact, the average weight of the brain of grey wolves is 0.120kg. (e) Find the percentage error in your estimate in part (d). [2] The average body weight of mice is {1.023 kg. (f) State whether it is valid to use the regression line to estimate the average weight of the brain of mice. Give a reason for your answer. [2] 6. M1 7I5IMATSDI'SPZI'ENGITZZ'H [Maximum mark: 13] The manager of a folder factory recorded the number of folders produced by the factory (in thousands} and the production costs {in thousand Euros). for six consecutive months. January February March Folders produced, I (thousands) Production costs, C thousand Euros ()a Draw a scatter diagram for this data. Use a scale of 2cm for 5000 folders on the horizontal axis and 2cm for 10000 Euros on the vertical axis. (b) Write down, for this set of data (i) the mean number of folders produced, 1? (ii) the mean production cost, 5. (c) Label the point ME, 5] on the scatter diagram. (d) Use your graphic display calculator to nd the Pearson's productmoment correlation coefcient, r. (e) State a reason why the regression line C on x is appropriate to model the relationship between these variables. (f) Use your graphic display calculator to nd the equation of the regression line C on x. (g) Draw the regression line C on x on the scatter diagram. Every month the factory sells all the folders produced. Each folder is sold for 2.99 Euros. (h) Use the equation of the regression line to estimate the least number of folders that the factory needs to sell in a month to exceed its production cost for that month. [4] l2] l1] l2] l1] l2] l2] l4]