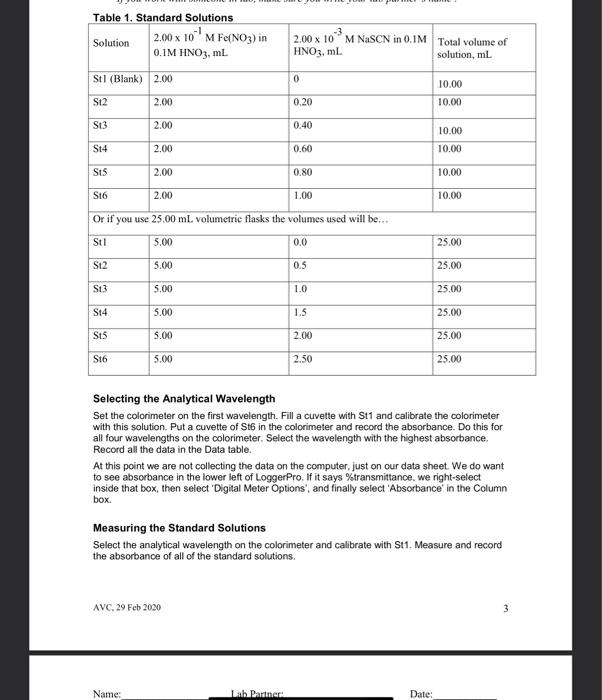
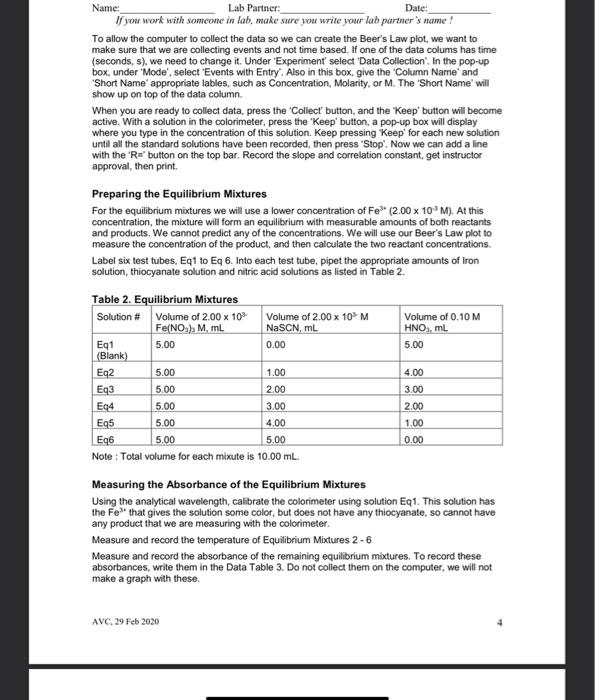
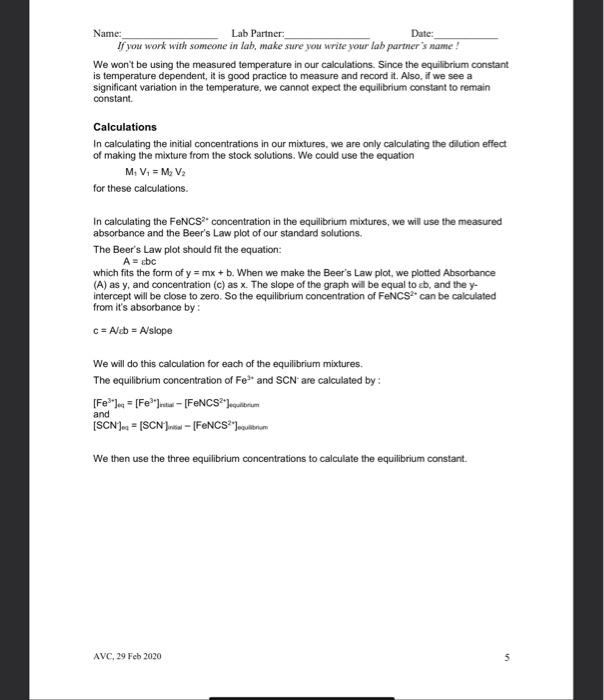
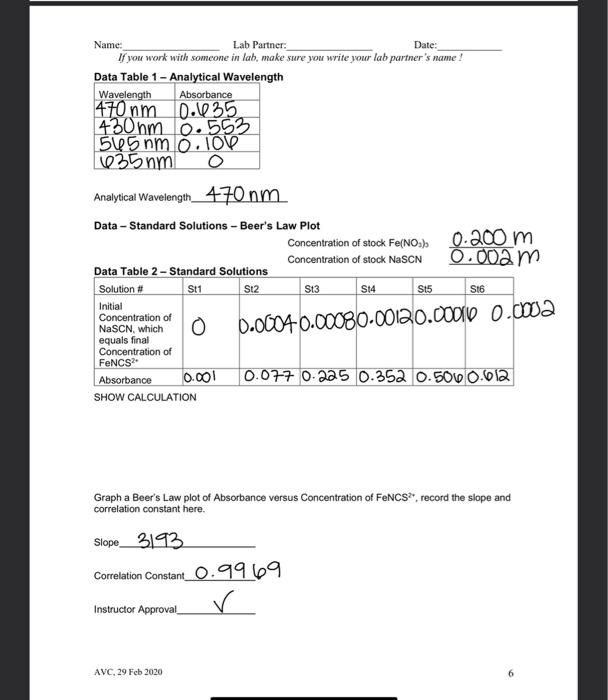
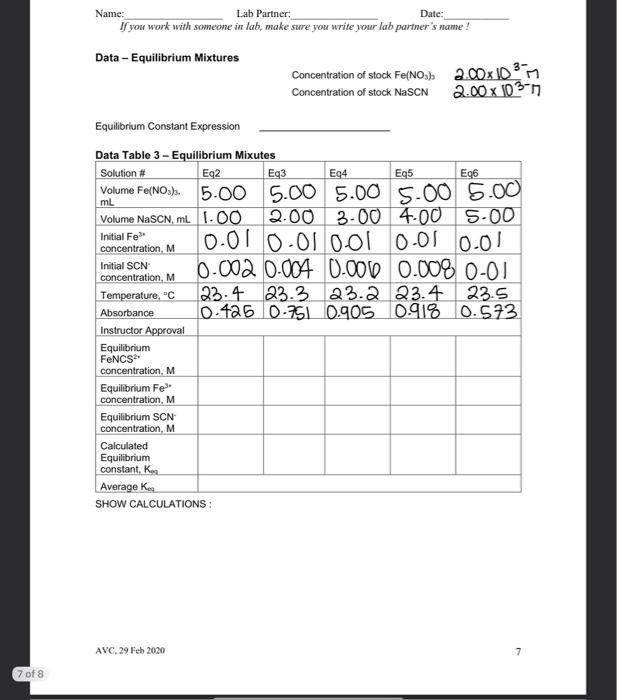
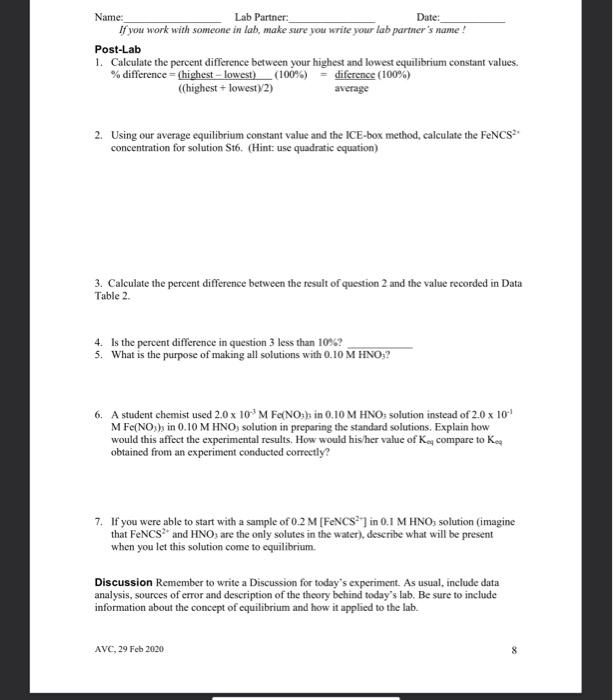
Name: Date: Lab Partner: If you work with someone in lab, make sure you write your lah partner's name! Measuring the Equilibrium Constant of Iron (III) ion with the Thiocyanate lon Purpose The purpose of this lab is to use spectrophotometric methods to measure the equilibrium constant of the equilibrium reaction between the iron (III)ion and the thiocyanate in Background The reaction of the iron (III) ion with the thiocyanate ion to produce the isothiocyanatoiron (II) ion, a coordination complex ion, is a reversible reaction. That means that it will form an equilibrium mixture. It is suitable for study because, as with most coordination complex ions, the ion is colored. We will be able to use this color to measure concentration of the coordination complex ion using a spectrophotometer or a colorimeter. Fe"(aq) pale yellow} + SCN (aq)colorless] FONCS?"(aq)|blood red] The spectrophotometer or colorimeter cannot give us concentration directly. We first need to make a standard/calibration Beer's Law plot using known concentrations of the product, the isothiocyanatoiron (III)ion. This is a challenge since reversible reactions don't go to completion However, if we can push the reaction far enough to the products, then it will essentially go to completion and give us the desired concentration After completion of our measurement of the equilibrium constant, we should check any assumptions we made in this process. To force the reaction to the product we should make one reactant to be a large excess compared to the limiting reactant. This will force essentially all the limiting reactant into the product. So we can use the information of the limiting reactant to derive the concentration of the complex ion. Wavelength of Spectrophotometer/Colorimeter When selecting a wavelength for observing a compound, we generally want the wavelength of a the strongest absorbance. This makes the absorbance measurement to be the most sensitive to the concentration. We may choose to select a different wavelength if there is interference at the desired wavelength from another compound. Blank for Spectrophotometer/Colorimeter Different spectrophotometer/colorimeters can have different calibration techniques, but will all require a blank. A blank should contain all the chemicals of color present in your reaction mixtures except for the one to be measured. So for this process, we will need the Feion to be in our blank at the same concentration as used in our reaction mixtures. AVC, 29 Feb 2020 Name: Lab Partner: Date: If you work with someone in lab, make sure you write your lab partner's name ! Ionic Strength At this level of chemistry we describe our equilibrium expressions as depending on the molarity of the species involved. This is not strictly true. We find that the equilibrium constant appears to change based on the environment it is in. We correct this later in physical chemistry by using a property called the activity of the species which is derived from molarity. The environmental condition that affects this reaction is the ionic strength of the solution. The changing concentrations of our solutions would change the ionic strength of the solution and could affect the results. So we use a background ion (doesn't participate in the reaction) at higher concentration to keep the ionic strength constant. All of our solutions will contain 0.10 M HNO to maintain the ionic strength. And we will dilute complete our solutions using 0.10 M HNOS instead of Di water Calibration/Standard Solutions The colorimeter/spectrophotometer (as with all instruments) needs calibration. We will do this by preparing a series of calibration solutions, measuring their absorbance and plotting the points, which will follow Beer's Law. The Beer's Law plot is then used to turn the absorbance measurements of the equilibrium mixtures (our unknowns) into concentration values. This allows us to know the concentration of the product when absorbance is measured. From that concentration we can calculate the other concentrations, then finally determine the equilibrium constant To make known concentrations for an equilibrium mixture is a challenge. These reactions do not go to completion. Our goal is to use a large difference in concentrations to push the reaction essentially to completion. It depends on the value of the equilibrium constant for us to succeed. So, as when all assumptions are made after completion of the experiment, the assumption needs to be verified before the results can be accepted. To make our standard solutions, we will use a 0.200 M Fe and a 0.00200 M SCN. The iron concentration is a hundred times the thiocyanate concentration. The assumption that we will make, is that all of the thiocyanate is converted into product. This allows to calculate the concentration of the isothiocyanatoiron (III) ion (FeNCS2) which is the ion that we are measuring with the spectrophotometers. Procedure Preparing Standard Solutions Get six 10 mL volumetric flasks and lebel them St1 through Sto, we will make our six standard solutions in these. Get approximately 15-20 mL of the 0 200 M Fesolution. It is important to use the right concentration, we have two iron solutions available to us today. Pipet 2.00 mL of the 0.200 M Fe solution into each of the six volumetric flasks. Then pipet the appropriate amount of sodium thiocynate into each flask as listed in Table 1. Fill each flask to the mark with 0.10 M nitric acid solution, and mix. Record the stock concentrations and the calculated initial (diluted) concentrations of NaSCN in the Data Section. Since we are making the assumption that all of the initial NaSCN is pushed into the product, the initial NaSCN (SCN) concentration will equal the final FeNCS concentration AVC, 29 Feb 2020 2 Table 1. Standard Solutions Solution 2.00 x 10M Fe(NO3) in 0.1M HNO3, ml. Stl (Blank) 2.00 -3 2.00 x 10M NaSCN in 0.1M Total volume of HNO3, ml. solution, ml 0 10.00 St2 2.00 0.20 10.00 St3 2.00 0.40 10.00 St4 2.00 0.60 10.00 S15 2.00 0.80 10.00 S16 2.00 1.00 10.00 Or if you use 25.00 mL volumetric flasks the volumes used will be... St1 5.00 0.0 25.00 St2 5.00 0.5 25.00 St3 5.00 1.0 25.00 S14 5.00 1.5 25.00 SUS 5.00 2.00 25.00 S16 5.00 2.50 25.00 Selecting the Analytical Wavelength Set the colorimeter on the first wavelength. Fill a cuvette with St1 and calibrate the colorimeter with this solution. Put a cuvette of Sth in the colorimeter and record the absorbance. Do this for all four wavelengths on the colorimeter. Select the wavelength with the highest absorbance. Record all the data in the Data table. At this point we are not collecting the data on the computer, just on our data sheet. We do want to see absorbance in the lower left of LoggerPro. If it says %transmittance, we right-select inside that box, then select 'Digital Meter Options', and finally select 'Absorbance in the Column box Measuring the Standard Solutions Select the analytical wavelength on the colorimeter and calibrate with St1. Measure and record the absorbance of all of the standard solutions. AVC, 29 Feb 2020 3 Name: Lab Partner Date: Name: Lab Partner: Date: If you work with someone in lab, make sure you write your lab partner's name! To allow the computer to collect the data so we can create the Beer's Law plot, we want to make sure that we are collecting events and not time based. If one of the data colums has time (seconds, s), we need to change it. Under 'Experiment' select Data Collection. In the pop-up box, under Mode', select 'Events with Entry. Also in this box, give the Column Name' and Short Name' appropriate tables, such as Concentration, Molarity, or M. The 'Short Name' will show up on top of the data column When you are ready to collect data, press the Collect button and the Keep' button will become active. With a solution in the colorimeter, press the "Keep' button, a pop-up box will display where you type in the concentration of this solution. Keep pressing Keep' for each new solution until all the standard solutions have been recorded, then press 'Stop'. Now we can add a line with the 'R="button on the top bar. Record the slope and correlation constant, get instructor approval, then print. Preparing the Equilibrium Mixtures For the equilibrium mixtures we will use a lower concentration of Fe (2.00 x 10 M). At this concentration, the mixture will form an equilibrium with measurable amounts of both reactants and products. We cannot predict any of the concentrations. We will use our Beer's Law plot to measure the concentration of the product, and then calculate the two reactant concentrations. Label six test tubes, Eq1 to Eq 6. Into each test tube, pipet the appropriate amounts of Iron solution, thiocyanate solution and nitric acid solutions as listed in Table 2. Table 2. Equilibrium Mixtures Solution # Volume of 2.00 x 10 Volume of 2.00 10M Volume of 0.10 M Fe(NO) M. ml. NaSCN, mL HNO, ML Eq1 5.00 0.00 5.00 (Blank) Eq2 5.00 1.00 4.00 5.00 2.00 3.00 Eq4 5.00 3.00 2.00 Eq5 5.00 4.00 1.00 Eq6 5.00 0.00 Note: Total volume for each mixute is 10.00 mL. Measuring the Absorbance of the Equilibrium Mixtures Using the analytical wavelength, calibrate the colorimeter using solution Eq1. This solution has the Fe that gives the solution some color, but does not have any thiocyanate, so cannot have any product that we are measuring with the colorimeter. Measure and record the temperature of Equilibrium Mixtures 2-6 Measure and record the absorbance of the remaining equilibrium mixtures. To record these absorbances, write them in the Data Table 3. Do not collect them on the computer, we will not make a graph with these. Eq3 5.00 AVC, 29 Feb 2030 Name: Lab Partner: Date: If you work with someone in lab, make sure you write your la parter's name ! We won't be using the measured temperature in our calculations. Since the equilibrium constant is temperature dependent, it is good practice to measure and record it. Also, if we see a significant variation in the temperature, we cannot expect the equilibrium constant to remain constant Calculations In calculating the initial concentrations in our mixtures, we are only calculating the dilution effect of making the mixture from the stock solutions. We could use the equation M. V. = M, V2 for these calculations In calculating the FeNCS concentration in the equilibrium mixtures, we will use the measured absorbance and the Beer's Law plot of our standard solutions. The Beer's Law plot should fit the equation: A = sbc which fits the form of y = mx + b. When we make the Beer's Law plot, we plotted Absorbance (A) as y, and concentration (C) as X. The slope of the graph will be equal to sb, and they intercept will be close to zero. So the equilibrium concentration of FeNCS can be calculated from it's absorbance by C = Alcb = A/slope We will do this calculation for each of the equilibrium mixtures. The equilibrium concentration of Fe and SCN are calculated by : [Fe*).4 = [Fe").- FENCS"Jeg brum and [SCN) = (SCN) - [FeNCS")ulibrium We then use the three equilibrium concentrations to calculate the equilibrium constant. AVC, 29 Feb 2020 5 Name: Lab Partner: Date: If you work with someone in lah, make sure you write your lab partner's name ! Data Table 1 - Analytical Wavelength Wavelength Absorbance 470 nm 0.135 430 nm 0.553 565 nm 0.100 135 nmi O Analytical Wavelength_470 nm Data - Standard Solutions - Beer's Law Plot Concentration of stock Fe(NO.) 0.200 m Concentration of stock NaSCN 0.002 m Data Table 2 - Standard Solutions Solution # St1 S14 Initial Concentration of NaSCN, which O 0 0.0004 0.00080-00120.00016 0.002 equals final Concentration of FeNCS? Absorbance 0.001 0.077 0.225 0.352 0.500 0.612 SHOW CALCULATION St2 S13 S15 St6 Graph a Beer's Law plot of Absorbance versus Concentration of FeNCS", record the slope and correlation constant here. Slope_3193 Correlation Constant 0.9969 Instructor Approval AVC, 29 Feb 2020 6 Name: Lab Partner: Date: If you work with someone in lab, make sure you write your lab partner's name! Data - Equilibrium Mixtures Concentration of stock Fe(NO3). 2.00x10377 Concentration of stock NaSCN 2.00x10³-7 Equilibrium Constant Expression Data Table 3 - Equilibrium Mixutes Solution # Eq2 Eq3 Eq4 Eq5 Eq6 Volume Fe(NO3). 5.00 5.00 5.00 5.00 5.00 ml Volume NaSCN, ml 1.00 2.00 3.00 4.00 5.00 Initial Fe 0.01 0.000 0.00 0.01 0.01 concentration, M Initial SCN 0.002 0.004 0.000 0.00% 0-01 concentration, M Temperature. "C 23.4 23.3 23.2 23.4 23.5 Absorbance 0-425 0.751 0.905 0.918 0.573 Instructor Approval Equilibrium FeNCS concentration, M Equilibrium Fe concentration, M Equilibrium SCN concentration, M Calculated Equilibrium constant, ko Average Ke SHOW CALCULATIONS: AVC, 29 Feb 2020 7 7 of 8 Name: Lab Partner Date: If you work with someone in lab, make sure you write your lab partner's name! Post-Lab 1. Calculate the percent difference between your highest and lowest equilibrium constant values. % difference = (highest - lowest) (100%) = diference (100%) (highest + lowest)2) average 2. Using our average equilibrium constant value and the ICE-box method, calculate the FeNCS concentration for solution St. (Hint: use quadratic equation) 3. Calculate the percent difference between the result of question 2 and the value recorded in Data Table 2. 4. Is the percent difference in question 3 less than 10%? 5. What is the purpose of making all solutions with 0.10 M HNO:? 6. A student chemist used 2.0 x 10% M Fe(NO3) in 0.10 M HNO: solution instead of 2.0 x 10 M Fe(NO) in 0.10 M HNOsolution in preparing the standard solutions. Explain how would this affect the experimental results. How would his/her value of Ke, compare to Ko obtained from an experiment conducted correctly? 7. If you were able to start with a sample of 0.2 M [FENCS") in 0.1 M HNO3 solution (imagine that FeNCS and HNO3 are the only solutes in the water), describe what will be present when you let this solution come to equilibrium Discussion Remember to write a Discussion for today's experiment. As usual, include data analysis, sources of error and description of the theory behind today's lab. Be sure to include information about the concept of equilibrium and how it applied to the lab. AVC, 29 Feb 2020