Answered step by step
Verified Expert Solution
Question
1 Approved Answer
Name This table shows the average annual cost for tuition, room, and board at all colleges in the United States between the 2000 and 2014
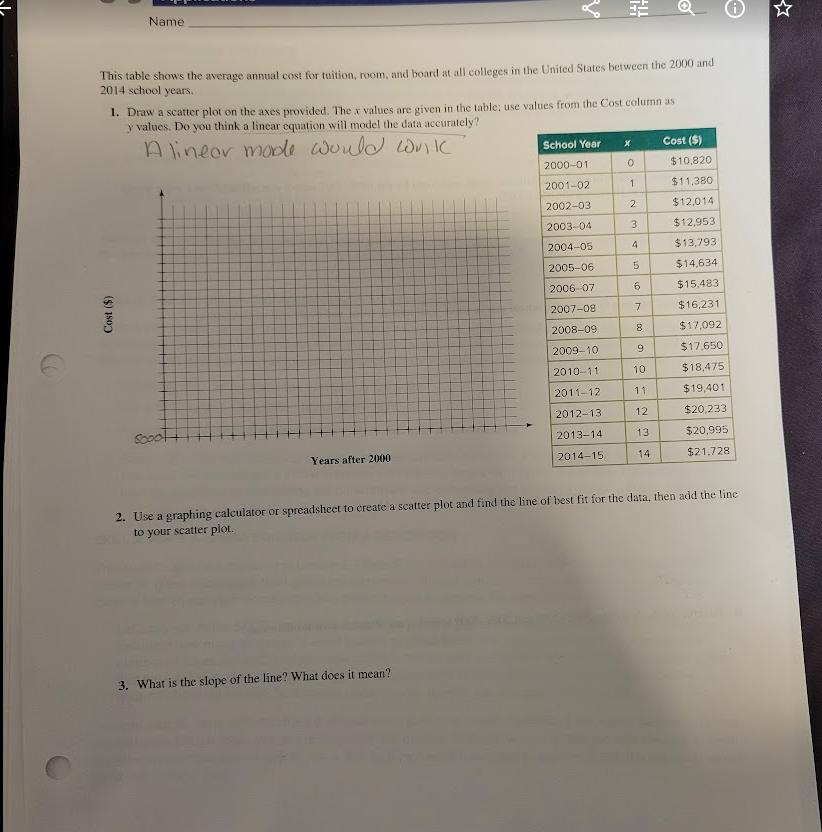
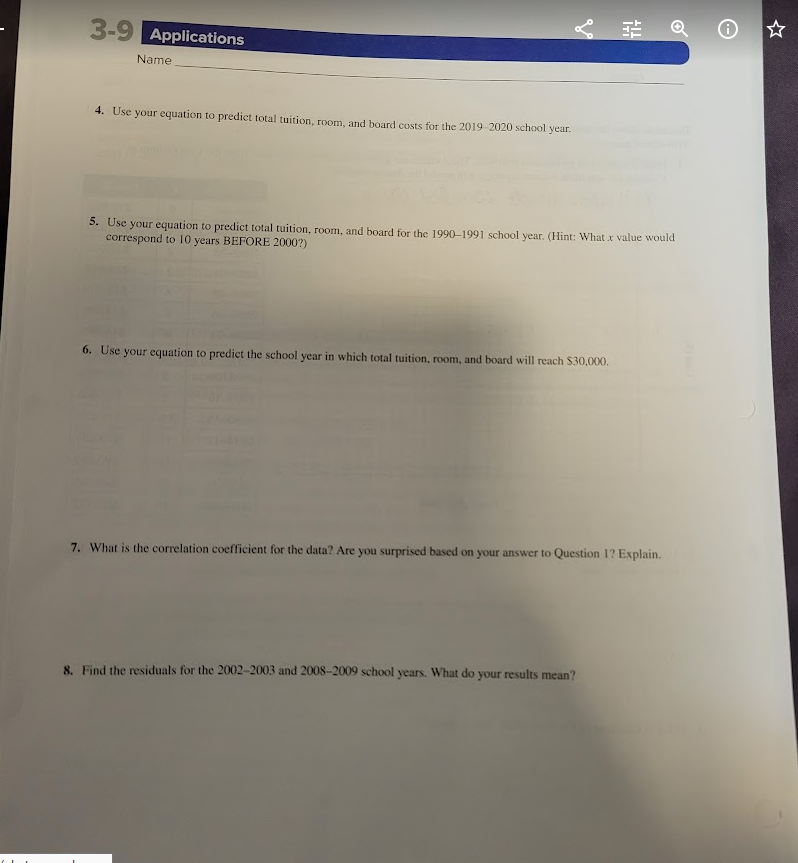
Name This table shows the average annual cost for tuition, room, and board at all colleges in the United States between the 2000 and 2014 school years. 1. Draw a scatter plot on the axes provided. The x values are given in the table; use values from the Cost column as y values. Do you think a linear equation will model the data accurately? A lineor mode would work School Year Cost ($) 2000-01 $10,820 2001-02 $11,380 2002-03 $12,014 2003-04 $12,953 2004-05 $13,793 2005-06 5 $14.634 2006-07 6 $15,483 Cost ($) 2007-08 7 $16,231 2008-09 3 $17,092 2009-10 9 $17.650 2010-11 10 $18,475 2011-12 11 $19,401 2012-13 12 $20,233 2013-14 13 $20,995 Years after 2000 2014-15 14 $21.728 2. Use a graphing calculator or spreadsheet to create a scatter plot and find the line of best fit for the data, then add the line to your scatter plot. 3. What is the slope of the line? What does it mean?3-9 Applications Name 4. Use your equation to predict total tuition, room, and board costs for the 2019 2020 school year. 5. Use your equation to predict total tuition, room, and board for the 1990-1991 school year. (Hint: What & value would correspond to 10 years BEFORE 2000?) 6. Use your equation to predict the school year in which total tuition, room, and board will reach $30,000. 7. What is the correlation coefficient for the data? Are you surprised based on your answer to Question 1? Explain. 8. Find the residuals for the 2002-2003 and 2008-2009 school years. What do your results mean
Step by Step Solution
There are 3 Steps involved in it
Step: 1
Get Instant Access to Expert-Tailored Solutions
See step-by-step solutions with expert insights and AI powered tools for academic success
Step: 2
Step: 3
Ace Your Homework with AI
Get the answers you need in no time with our AI-driven, step-by-step assistance
Get Started