

Answered step by step
Verified Expert Solution
Question
1 Approved Answer
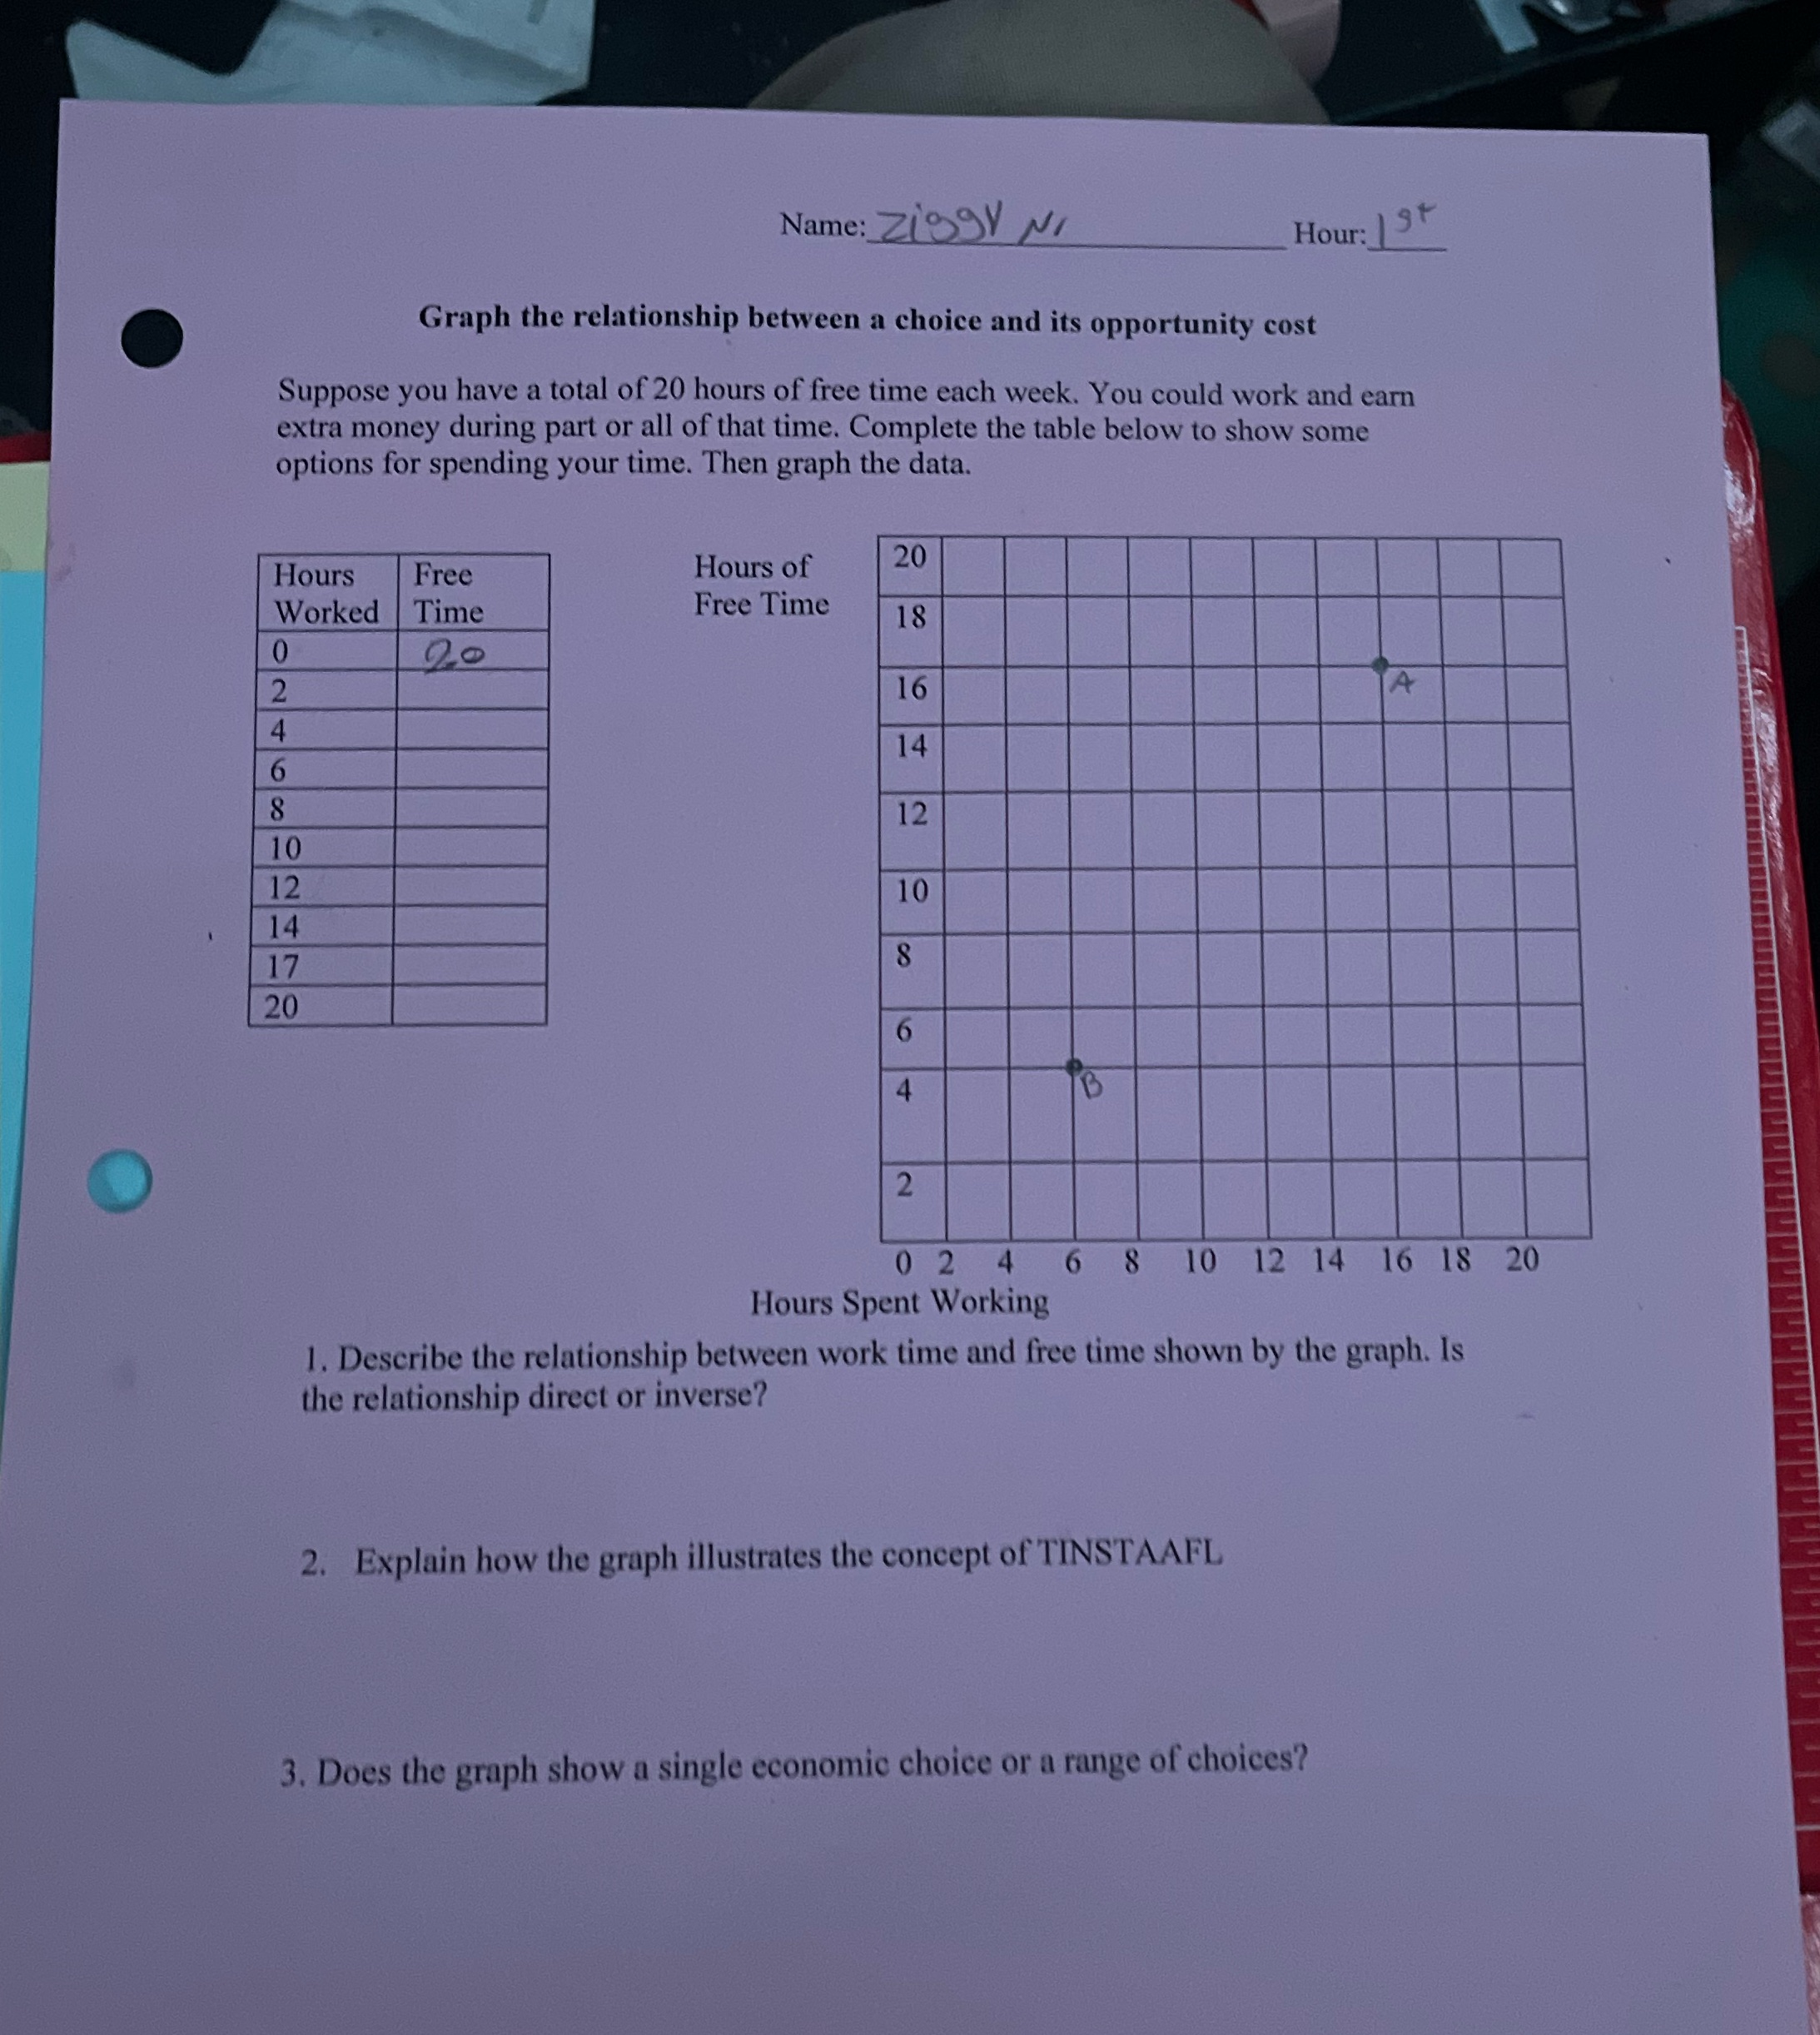
Name : ZiggY N/ Hour: |9t Graph the relationship between a choice and its opportunity cost Suppose you have a total of 20 hours of

Step by Step Solution
There are 3 Steps involved in it
Step: 1

Get Instant Access to Expert-Tailored Solutions
See step-by-step solutions with expert insights and AI powered tools for academic success
Step: 2

Step: 3
Ace Your Homework with AI
Get the answers you need in no time with our AI-driven, step-by-step assistance
Get Started
Economics
Authors: R. Glenn Hubbard, Anthony Patrick O Brien
7th edition
134738314, 9780134738116 , 978-0134738321