Question
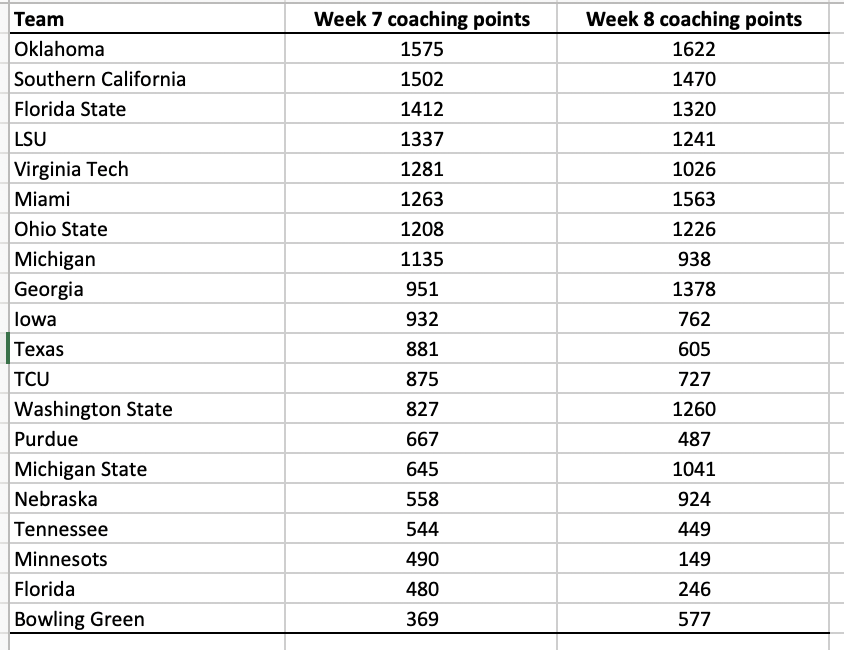
Navigate to the sheet titled Football Coach Ratings. This data set shows the coaching points (measure of a coach's quality during a specific game, typically
Navigate to the sheet titled Football Coach Ratings. This data set shows the coaching points (measure of a coach's quality during a specific game, typically awarded by other coaches) for a sample of college football teams during Week 7 and Week 8 of last season. We are interested to see if there is correlation between these 2 weeks. Calculate the Pearson correlation coefficient, the Spearman correlation coefficient, and then perform a hypothesis test of whether the Spearman correlation coefficient might really be zero. When finished, answer the following.

Step by Step Solution
There are 3 Steps involved in it
Step: 1

Get Instant Access to Expert-Tailored Solutions
See step-by-step solutions with expert insights and AI powered tools for academic success
Step: 2

Step: 3

Ace Your Homework with AI
Get the answers you need in no time with our AI-driven, step-by-step assistance
Get Started


