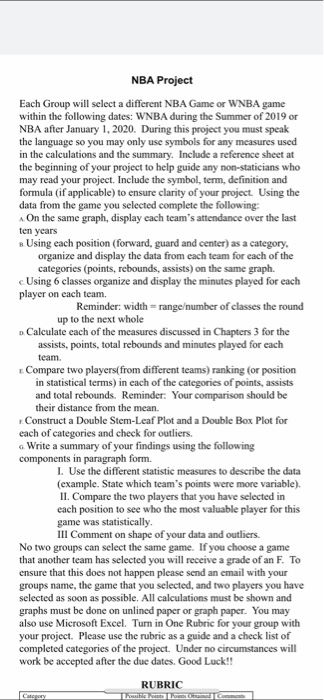
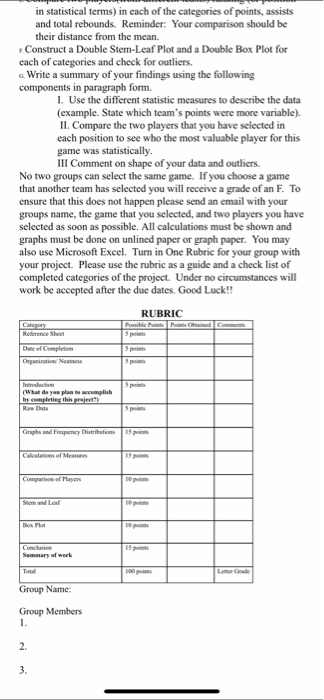
NBA Project Each Group will select a different NBA Game or WNBA game within the following dates: WNBA during the Summer of 2019 or NBA after January 1, 2020. During this project you must speak the language so you may only use symbols for any measures used in the calculations and the summary. Include a reference sheet at the beginning of your project to help guide any non-staticians who may read your project. Include the symbol, term, definition and formula (if applicable) to ensure clarity of your project. Using the data from the game you selected complete the following: On the same graph, display each team's attendance over the last ten years Using each position (forward, guard and center) as a category. organize and display the data from each team for each of the categories (points, rebounds, assists) on the same graph. Using 6 classes organize and display the minutes played for each player on each team. Reminder: width = rangeumber of classes the round up to the next whole Calculate each of the measures discussed in Chapters 3 for the assists, points, total rebounds and minutes played for each team. Compare two players(from different teams) ranking (or position in statistical terms) in each of the categories of points, assists and total rebounds. Reminder: Your comparison should be their distance from the mean. Construct a Double Stem-Leaf Plot and a Double Box Plot for each of categories and check for outliers. a. Write a summary of your findings using the following components in paragraph form. I. Use the different statistic measures to describe the data (example. State which team's points were more variable). II. Compare the two players that you have selected in each position to see who the most valuable player for this game was statistically III Comment on shape of your data and outliers. No two groups can select the same game. If you choose a game that another team has selected you will receive a grade of an F. To ensure that this does not happen please send an email with your groups name, the game that you selected, and two players you have selected as soon as possible. All calculations must be shown and graphs must be done on unlined paper or graph paper. You may also use Microsoft Excel. Turn in One Rubric for your group with your project. Please use the rubric as a guide and a check list of completed categories of the project. Under no circumstances will work be accepted after the due dates. Good Luck!! RUBRIC in statistical terms) in each of the categories of points, assists and total rebounds. Reminder: Your comparison should be their distance from the mean. Construct a Double Stem-Leaf Plot and a Double Box Plot for cach of categories and check for outliers. a. Write a summary of your findings using the following components in paragraph form. 1. Use the different statistic measures to describe the data (example. State which team's points were more variable). II. Compare the two players that you have selected in each position to see who the most valuable player for this game was statistically III Comment on shape of your data and outliers. No two groups can select the same game. If you choose a game that another team has selected you will receive a grade of an F. To ensure that this does not happen please send an email with your groups name, the game that you selected, and two players you have selected as soon as possible. All calculations must be shown and graphs must be done on unlined paper or graph paper. You may also use Microsoft Excel. Turn in One Rubric for your group with your project. Please use the rubric as a guide and a check list of completed categories of the project. Under no circumstances will work be accepted after the due dates. Good Luck!! RUBRIC Possible to come Games Reference Sheet Dute of Completi Spo Introduction (What do you plan to accomplish by completing the projet Raw Duta po Graphs and Frequency Distributions poems Calculations of Me Compare of Mayen 1 Conclusion Summary of work Gode Group Name: Group Members 1. 2. 3. NBA Project Each Group will select a different NBA Game or WNBA game within the following dates: WNBA during the Summer of 2019 or NBA after January 1, 2020. During this project you must speak the language so you may only use symbols for any measures used in the calculations and the summary. Include a reference sheet at the beginning of your project to help guide any non-staticians who may read your project. Include the symbol, term, definition and formula (if applicable) to ensure clarity of your project. Using the data from the game you selected complete the following: On the same graph, display each team's attendance over the last ten years Using each position (forward, guard and center) as a category. organize and display the data from each team for each of the categories (points, rebounds, assists) on the same graph. Using 6 classes organize and display the minutes played for each player on each team. Reminder: width = rangeumber of classes the round up to the next whole Calculate each of the measures discussed in Chapters 3 for the assists, points, total rebounds and minutes played for each team. Compare two players(from different teams) ranking (or position in statistical terms) in each of the categories of points, assists and total rebounds. Reminder: Your comparison should be their distance from the mean. Construct a Double Stem-Leaf Plot and a Double Box Plot for each of categories and check for outliers. a. Write a summary of your findings using the following components in paragraph form. I. Use the different statistic measures to describe the data (example. State which team's points were more variable). II. Compare the two players that you have selected in each position to see who the most valuable player for this game was statistically III Comment on shape of your data and outliers. No two groups can select the same game. If you choose a game that another team has selected you will receive a grade of an F. To ensure that this does not happen please send an email with your groups name, the game that you selected, and two players you have selected as soon as possible. All calculations must be shown and graphs must be done on unlined paper or graph paper. You may also use Microsoft Excel. Turn in One Rubric for your group with your project. Please use the rubric as a guide and a check list of completed categories of the project. Under no circumstances will work be accepted after the due dates. Good Luck!! RUBRIC in statistical terms) in each of the categories of points, assists and total rebounds. Reminder: Your comparison should be their distance from the mean. Construct a Double Stem-Leaf Plot and a Double Box Plot for cach of categories and check for outliers. a. Write a summary of your findings using the following components in paragraph form. 1. Use the different statistic measures to describe the data (example. State which team's points were more variable). II. Compare the two players that you have selected in each position to see who the most valuable player for this game was statistically III Comment on shape of your data and outliers. No two groups can select the same game. If you choose a game that another team has selected you will receive a grade of an F. To ensure that this does not happen please send an email with your groups name, the game that you selected, and two players you have selected as soon as possible. All calculations must be shown and graphs must be done on unlined paper or graph paper. You may also use Microsoft Excel. Turn in One Rubric for your group with your project. Please use the rubric as a guide and a check list of completed categories of the project. Under no circumstances will work be accepted after the due dates. Good Luck!! RUBRIC Possible to come Games Reference Sheet Dute of Completi Spo Introduction (What do you plan to accomplish by completing the projet Raw Duta po Graphs and Frequency Distributions poems Calculations of Me Compare of Mayen 1 Conclusion Summary of work Gode Group Name: Group Members 1. 2. 3