Answered step by step
Verified Expert Solution
Question
1 Approved Answer
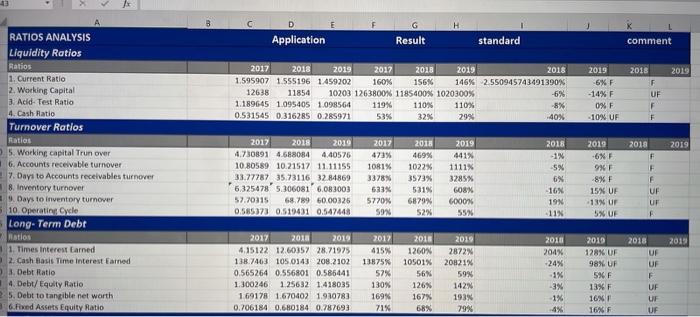
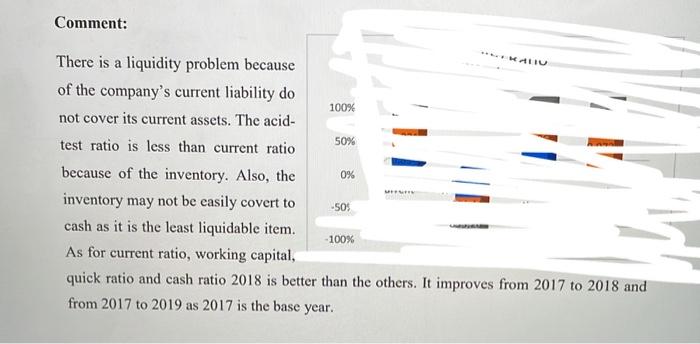
need a comment on liquidty ratios, turn-over ratios, long term dept, profitablity and long-term dept ratios. example of a comment is shown below example E
need a comment on liquidty ratios, turn-over ratios, long term dept, profitablity and long-term dept ratios. example of a comment is shown below 


E F D Application G Result standard comment 2018 2019 F 2017 2018 2019 2017 2018 2019 2018 1.595907 1.555196 1.459202 160% 156% 146% 2550945743491390% 12638 11854 10203 1263800% 1185400% 1020300% -6% 1.189645 1.095405 1.098564 119% 110% 110% -8% 0.531545 0.316205 0.285971 53% 32% 29% -40% 2019 6% F -14% F 0% F -10% UF UF F F 2018 2019 2018 2019 RATIOS ANALYSIS Liquidity Ratios Ratios 1. Current Ratio 2. Working Capital 3 Acid Test Ratio 4. Cash Ratio Turnover Ratios Ratios 5. Working capital Trun over 6. Accounts receivable turnover 7. Days to Accounts receivables turnover 8. Inventory turnover 9. Days to inventory turnover 10 Operating Cycle Long-Term Debt Natios 1. Times Interest Larned 2. Cash Basis Time Interest Farned 3. Debt Ratio 4. Debt/ Equity Ratio 5. Debt to tangible net worth 6.Fixed Assets Equity Ratio 2017 2018 2019 4.730891 4.688084 4.40576 10.80589 10.21517 11.11155 33.77787 35 73116 32.84869 6325478 5.306081 6.083003 57.70315 68.789 60.00325 0.585373 0.519431 0.547448 2017 473% 1081% 33789 633% 5770% 59% 469% 1022% 3573% 531% 6879 52% 2019 441% 1111 3285% 608X 6000 55% 2018 -1 5% 6% 16% 19N - 11% 9% 8XF 15% UF 13N UP 5XUF F UF UT F 2019 2017 2018 2019 4.15122 12.60357 28.71975 138.7463 105.0143 208.2102 0.565264 0.556801 0.586441 1.300246 1.25632 1.418035 1 69178 1.670402 1.910783 0.706184 0.680184 0.787693 2012 415% 13875% 57% 130% 169% 71% 2018 1260% 10501% 56N 126% 167% 68% 2015 2872% 20821% 59% 142% 193% 79% 2018 204% -24% 1% -3% 2019 128% UF 98% UF 59 F 13% F 16% 16% 2018 UF UF F UF UF UF SSSSS 1% 4% Profitability Ratios 2019 2017 6X 2010 UF 94% 2017 2016 2019 0.05869 0.057065 0.069163 0.938898 0.903198 0,832561 0.055104 0.051541 0.057582 0.078125 0.059563 0.080981 0.178459 0.156651 0.190935 0.126752 0.116293 0.139236 6X 8% 18% 13% 2018 6% 90% SX 6% 16% 12% 2019 7% 838 6% 8% 1996 14% 2018 -3% 4% 6% -24% 12% -8% 2019 21% F -8% 129 36% UF 22% UF 20% F 1-SSSS UF UF UF UF Net Profit Margin Total Assets Turnover Return on Assets 4 Operating Income Martin S.Return on investment GReturn on Total Equity For the Investor Fatos 1. Earnings per common Share 2. Price/ Earnings Ratio 1 Percentage of Accumulated Retained Earrings 4. Percentage of Retained Earnings 5. Dividends Payout 6. Dividends Yield 7. Book Value per Common Share 2013 2017 2015 2019 81.60465 78.62791 89.55814 185.0299 1868828 154.1245 7.463953.397811 7.169566 1 1 1 0 0 0 0 141.514 676.1163 643.2033 2017 8160 18503% 746 100% 0 0% 643818 2010 UF UF UF 2010 2019 7863% 8956% 18683% 15412 40% 717% 100N 100% ON OX NA ON OX NA 67612% 643219 2018 4'N 15 139 0 NA NA 2019 14 F 18% - 15% UF OF 0 -S Comment: KALIU 0% There is a liquidity problem because of the company's current liability do 100% not cover its current assets. The acid- test ratio is less than current ratio 50% because of the inventory. Also, the inventory may not be easily covert to -50% cash as it is the least liquidable item. -100% As for current ratio, working capital, quick ratio and cash ratio 2018 is better than the others. It improves from 2017 to 2018 and from 2017 to 2019 as 2017 is the base year 

example

Step by Step Solution
There are 3 Steps involved in it
Step: 1

Get Instant Access to Expert-Tailored Solutions
See step-by-step solutions with expert insights and AI powered tools for academic success
Step: 2

Step: 3

Ace Your Homework with AI
Get the answers you need in no time with our AI-driven, step-by-step assistance
Get Started


