Need answers a and b, Thank you!
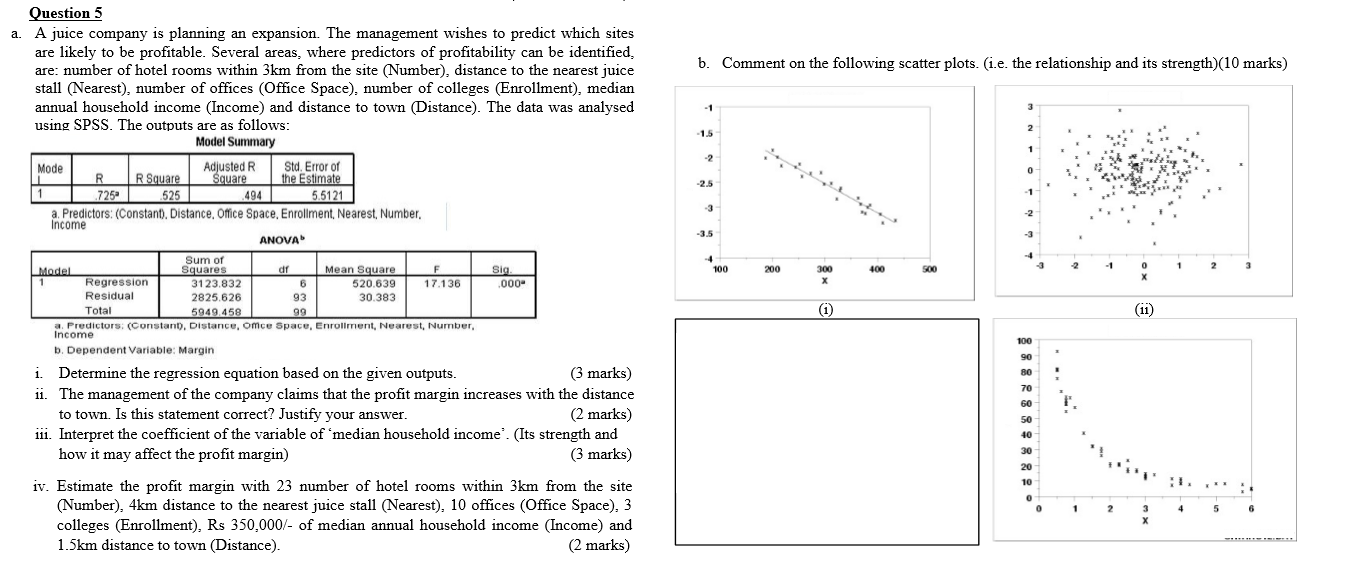
Question 5 a. A juice company is planning an expansion. The management wishes to predict which sites are likely to be profitable. Several areas, where predictors of profitability can be identified, are: number of hotel rooms within 3km from the site (Number), distance to the nearest juice b. Comment on the following scatter plots. (i.e. the relationship and its strength)(10 marks) stall (Nearest), number of offices (Office Space), number of colleges (Enrollment), median annual household income (Income) and distance to town (Distance). The data was analysed using SPSS. The outputs are as follows: 1.5 Model Summary Mode Adjusted R Std. Error of R R Square Square the Estimate -2.5 525 494 5.5121 a. Predictors: (Constant). Distance. Office Space. Enrollment. Nearest, Number. Income ANOVA -35 Sum of Model Squares Mean Square Sig 100 200 300 400 500 Regression 3123.832 6 520.639 17.136 000 X Residual 2825.626 93 30.383 Total 5949.458 99 (i) (1i) 1. Predictors; (Constant), Distance, Once Space, Enrollment, Nearest, Number. Income b. Dependent Variable: Margin 100 i. Determine the regression equation based on the given outputs. (3 marks) ii. The management of the company claims that the profit margin increases with the distance to town. Is this statement correct? Justify your answer. (2 marks) ili. Interpret the coefficient of the variable of 'median household income'. (Its strength and how it may affect the profit margin) (3 marks) iv. Estimate the profit margin with 23 number of hotel rooms within 3km from the site 83 8 58 8 8 8 8 (Number), 4km distance to the nearest juice stall (Nearest), 10 offices (Office Space), 3 2 5 colleges (Enrollment), Rs 350,000/- of median annual household income (Income) and 1.5km distance to town (Distance). (2 marks)