

Answered step by step
Verified Expert Solution
Question
1 Approved Answer
Need anwers of ratio of all three years and please read the last image as their is some other work begin{tabular}{|l|r|r|r|} hline & multicolumn{3}{c}{ Millions
Need anwers of ratio of all three years and please read the last image as their is some other work 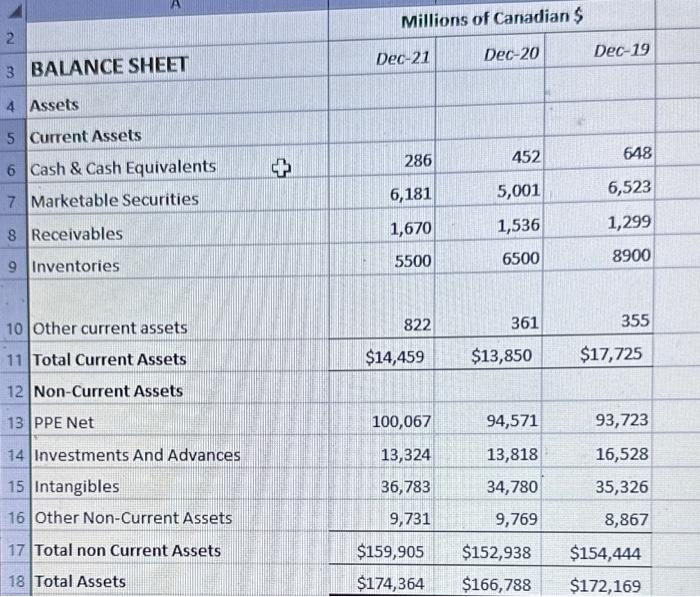
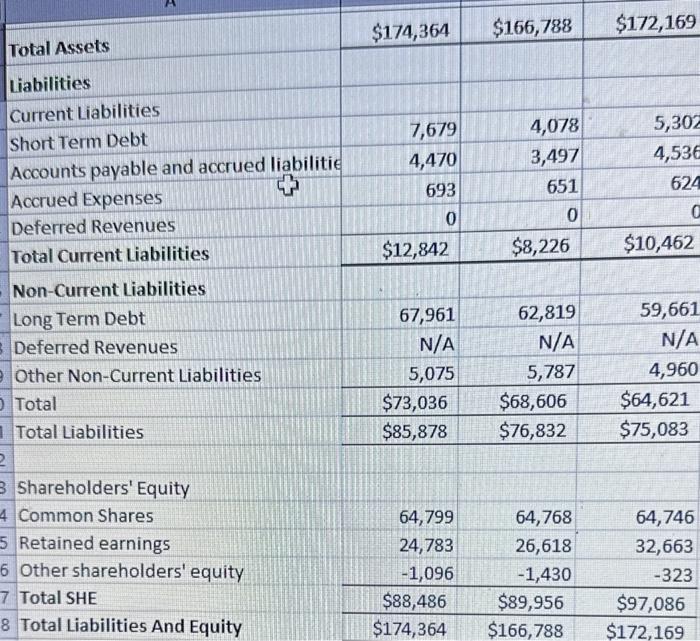
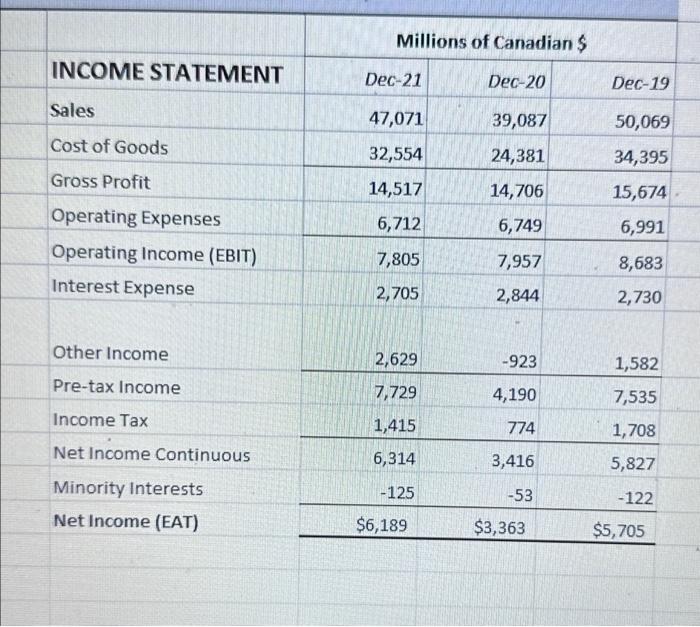
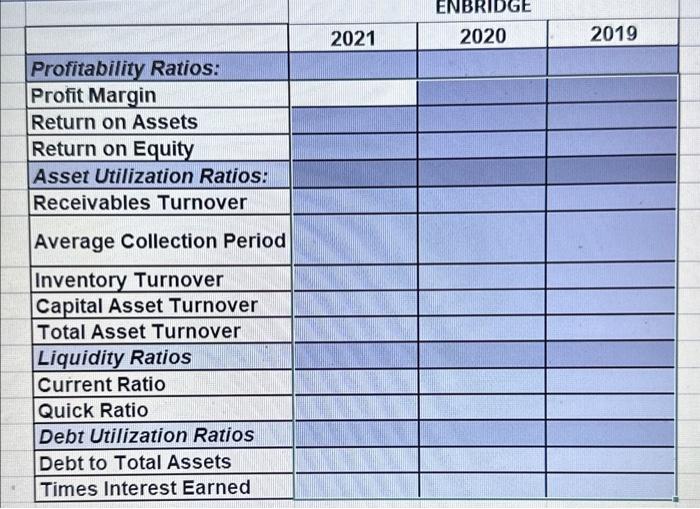
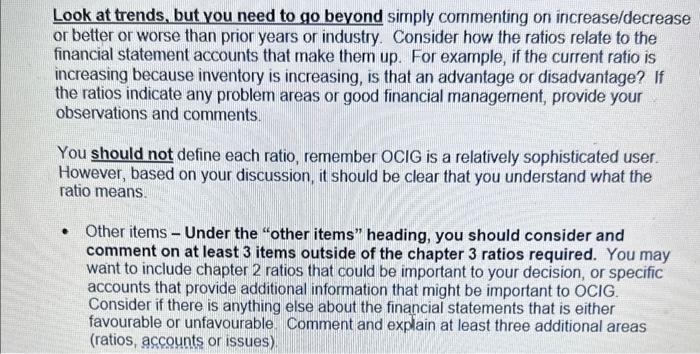
\begin{tabular}{|l|r|r|r|} \hline & \multicolumn{3}{c}{ Millions of Canadian \$ } \\ \hline INCOME STATEMENT & Dec-21 & Dec-20 & Dec-19 \\ \hline Sales & 47,071 & 39,087 & 50,069 \\ \hline Cost of Goods & 32,554 & 24,381 & 34,395 \\ \hline Gross Profit & 14,517 & 14,706 & 15,674 \\ \hline Operating Expenses & 6,712 & 6,749 & 6,991 \\ \hline Operating Income (EBIT) & 7,805 & 7,957 & 8,683 \\ \hline Interest Expense & 2,705 & 2,844 & 2,730 \\ \hline & & & \\ \hline Other Income & 2,629 & 923 & 1,582 \\ \hline Pre-tax Income & 7,729 & 4,190 & 7,535 \\ \hline Income Tax & 1,415 & 774 & 1,708 \\ \hline Net Income Continuous & 6,314 & 3,416 & 5,827 \\ \hline Minority Interests & 125 & 53 & 122 \\ \hline Net Income (EAT) & $6,189 & $3,363 & $5,705 \\ \hline \end{tabular} \begin{tabular}{|l|l|l|l|} \hline & & \multicolumn{3}{|c|}{ ENBRIDGE } \\ \hline & & 2021 & 2019 \\ \hline Profitability Ratios: & & & \\ \hline Profit Margin & & & \\ \hline Return on Assets & & & \\ \hline Return on Equity & & & \\ \hline Asset Utilization Ratios: & & & \\ \hline Receivables Turnover & & & \\ \hline Average Collection Period & & & \\ \hline Inventory Turnover & & & \\ \hline Capital Asset Turnover & & & \\ \hline Total Asset Turnover & & & \\ \hline Liquidity Ratios & & & \\ \hline Current Ratio & & & \\ \hline Quick Ratio & & & \\ \hline Debt Utilization Ratios & & & \\ \hline Debt to Total Assets & & & \\ \hline Times Interest Earned & & & \\ \hline \end{tabular} Look at trends, but you need to go beyond simply commenting on increase/decrease or better or worse than prior years or industry. Consider how the ratios relate to the financial statement accounts that make them up. For example, if the current ratio is increasing because inventory is increasing, is that an advantage or disadvantage? If the ratios indicate any problem areas or good financial management, provide your observations and comments. You should not define each ratio, remember OCIG is a relatively sophisticated user. However, based on your discussion, it should be clear that you understand what the ratio means. - Other items - Under the "other items" heading, you should consider and comment on at least 3 items outside of the chapter 3 ratios required. You may want to include chapter 2 ratios that could be important to your decision, or specific accounts that provide additional information that might be important to OCIG. Consider if there is anything else about the financial statements that is either favourable or unfavourable. Comment and explain at least three additional areas (ratios, accounts or issues) \begin{tabular}{|l|r|r|r|} \hline & \multicolumn{3}{c}{ Millions of Canadian \$ } \\ \hline INCOME STATEMENT & Dec-21 & Dec-20 & Dec-19 \\ \hline Sales & 47,071 & 39,087 & 50,069 \\ \hline Cost of Goods & 32,554 & 24,381 & 34,395 \\ \hline Gross Profit & 14,517 & 14,706 & 15,674 \\ \hline Operating Expenses & 6,712 & 6,749 & 6,991 \\ \hline Operating Income (EBIT) & 7,805 & 7,957 & 8,683 \\ \hline Interest Expense & 2,705 & 2,844 & 2,730 \\ \hline & & & \\ \hline Other Income & 2,629 & 923 & 1,582 \\ \hline Pre-tax Income & 7,729 & 4,190 & 7,535 \\ \hline Income Tax & 1,415 & 774 & 1,708 \\ \hline Net Income Continuous & 6,314 & 3,416 & 5,827 \\ \hline Minority Interests & 125 & 53 & 122 \\ \hline Net Income (EAT) & $6,189 & $3,363 & $5,705 \\ \hline \end{tabular} \begin{tabular}{|l|l|l|l|} \hline & & \multicolumn{3}{|c|}{ ENBRIDGE } \\ \hline & & 2021 & 2019 \\ \hline Profitability Ratios: & & & \\ \hline Profit Margin & & & \\ \hline Return on Assets & & & \\ \hline Return on Equity & & & \\ \hline Asset Utilization Ratios: & & & \\ \hline Receivables Turnover & & & \\ \hline Average Collection Period & & & \\ \hline Inventory Turnover & & & \\ \hline Capital Asset Turnover & & & \\ \hline Total Asset Turnover & & & \\ \hline Liquidity Ratios & & & \\ \hline Current Ratio & & & \\ \hline Quick Ratio & & & \\ \hline Debt Utilization Ratios & & & \\ \hline Debt to Total Assets & & & \\ \hline Times Interest Earned & & & \\ \hline \end{tabular} Look at trends, but you need to go beyond simply commenting on increase/decrease or better or worse than prior years or industry. Consider how the ratios relate to the financial statement accounts that make them up. For example, if the current ratio is increasing because inventory is increasing, is that an advantage or disadvantage? If the ratios indicate any problem areas or good financial management, provide your observations and comments. You should not define each ratio, remember OCIG is a relatively sophisticated user. However, based on your discussion, it should be clear that you understand what the ratio means. - Other items - Under the "other items" heading, you should consider and comment on at least 3 items outside of the chapter 3 ratios required. You may want to include chapter 2 ratios that could be important to your decision, or specific accounts that provide additional information that might be important to OCIG. Consider if there is anything else about the financial statements that is either favourable or unfavourable. Comment and explain at least three additional areas (ratios, accounts or issues) Step by Step Solution
There are 3 Steps involved in it
Step: 1

Get Instant Access to Expert-Tailored Solutions
See step-by-step solutions with expert insights and AI powered tools for academic success
Step: 2

Step: 3
Ace Your Homework with AI
Get the answers you need in no time with our AI-driven, step-by-step assistance
Get Started
Essentials Of Xbrl Financial Reporting In The 21st Century
Authors: Bryan Bergeron
1st Edition
0471220779, 978-0471220770