need correct solution with details :-
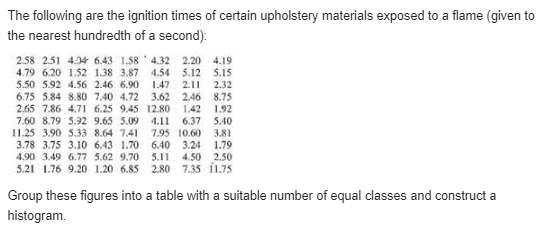
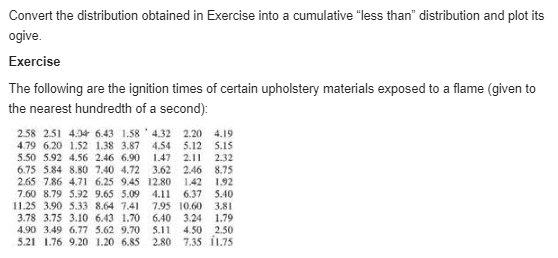
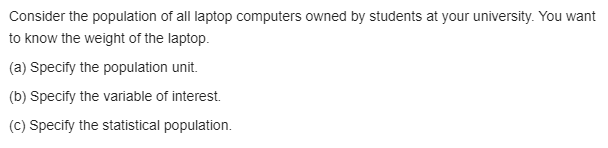
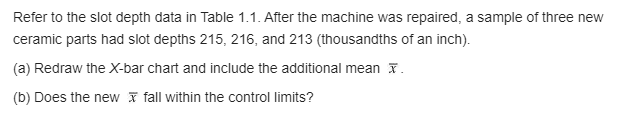
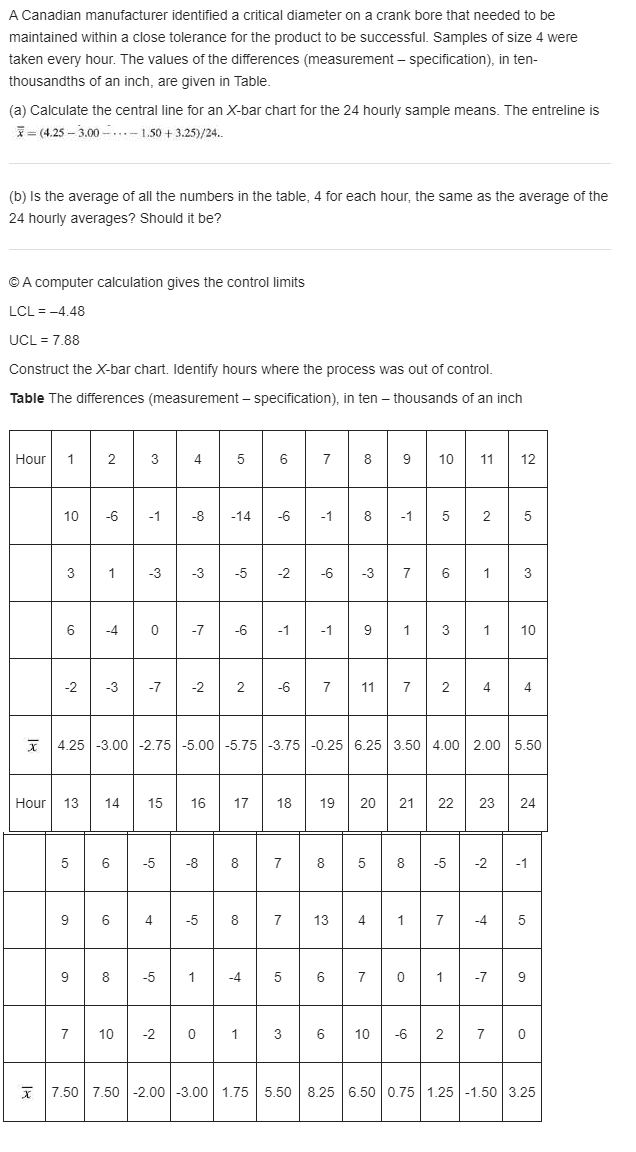
Probes for noninvasive measurement of blood flow must not give off too much energy (milliwatts per square centimeter). A sample of 12 probes yielded the energy values: 9, 10, 6, 7, 9, 7, 9, 6, 8, 5, 10, and 12 Construct a dot diagram.\f\fThe breaking forces (Ibf) of salt pellets, given to the nearest tenth, are grouped into a table having the classes [140.0, 160.0), [160.0, 180.0), [180.0, 200.0), [200.0, 220.0), [220.0, 240.0), and [240.0, 260.0), where the left-hand endpoint is included but the right-hand endpoint is not. Find (a) the class marks (b) the class intervalThe following are the ignition times of certain upholstery materials exposed to a flame (given to the nearest hundredth of a second): 258 251 454 6.43 1.58 432 2.20 4.19 4.79 6.20 1.52 1.38 3.87 4.54 5.12 5.15 5.50 5.92 4.56 246 6.90 1.47 2.11 2.32 6.75 5.84 8.50 7.40 4.72 3.62 2.46 8.75 2.65 7.86 4.71 6.25 9.45 12 80 1.42 1.92 7.60 8.79 5.32 9.65 5.09 4.11 6.37 5.40 11.25 3.90 5.33 8.64 7.41 7.95 10.60 3.81 3.78 3.75 3.10 6.43 1.70 6.40 3.24 1.79 4.90 3.49 6.77 5.62 9.70 5.11 450 2.50 5.21 1.76 9.20 1.20 6.85 2.80 7.35 11.75 Group these figures into a table with a suitable number of equal classes and construct a histogram.Convert the distribution obtained in Exercise into a cumulative "less than" cistn'bution and plot its oghre. Exercise The following are the igrition mes of certain upholstery materials exposed to a ame {given to the nearest hundredth of a second}: L's: 2.5I 4.50-6.13 IJB'L}! 12o are no 5.10 1.51 1.3: m 4.51 in: 5.15 no 531 us 145 no M! 1\" 131 15.15 3.\" an: 1.40 4.12 3.01 2.40 5.11 2.65 116 $.11 0.15 9.45 I130 HI I.\" 1.60 3.19 331 5.03 3.09 a.\" 0.31 3.40 \".23 3.90 3.33 0.034 'MI 1.9! I000 3.!l 3.13 3.15 3.10 6.13 L10 5.40 3:31 [.15I no 149 an 5.51 9.10 5." no on 3.2I [.10 9.20 [.10 0.55 2.30 1.35 \".15 Consider the population of all laptop computers owned by students at your university. You want to know the 1lireiciht of the laptop. {a} Specify the population unit. {h} Specify the yanahle of interest {c} Specify the statistical population. Identify.r the statistical population, sample, and vanaole of interest in each otthe following situations: {a} To learn about starh'ng salaries for engineers graduating from a Midwestem university, til-renty.r graduating seniors are asked to report their starting salary. in} Fittyr computer memory chips were selected from the thousand manufactured that day. The oomputer me lTIDT'j' chips were tested, and 5 were found to be defective. {c} Tensile strength was measured on 2d specimens made of a new plastic material. The intent is to learn about the tensile strengths for all specimens that could conceivably be manufactured with the new plastic material. Refer to the slot depth data in Table 1.1. After the machine was repaired, a sample pfthree newr ceramic parts had slot depths 215, 21 E, and 213 (theusandths of an inch}. is) Redrawthe Xhar chart and include the additional mean f. {h} D065 the new i fall within thE control limits? A Canadian manufacturer identified a critical diameter on a crank bore that needed to be maintained within a close tolerance for the product to be successful. Samples of size 4 were taken every hour. The values of the differences (measurement - specification), in ten- thousandths of an inch, are given in Table. (a) Calculate the central line for an X-bar chart for the 24 hourly sample means. The entreline is = (4.25 - 3.00 -. ..- 1.50 + 3.25)/24.. (b) Is the average of all the numbers in the table, 4 for each hour, the same as the average of the 24 hourly averages? Should it be? @ A computer calculation gives the control limits LCL = -4.48 UCL = 7.88 Construct the X-bar chart. Identify hours where the process was out of control. Table The differences (measurement - specification), in ten - thousands of an inch Hour 1 2 3 4 5 6 7 8 9 10 11 12 10 -6 -1 -8 -14 -6 -1 8 -1 5 2 5 3 1 -3 -3 -5 -2 -6 -3 7 6 1 3 6 -4 0 -7 -6 -1 -1 9 1 3 1 10 -2 -3 -7 -2 2 -6 7 11 7 2 4 4 4.25 -3.00 -2.75 -5.00 -5.75 -3.75 -0.25 6.25 3.50 4.00 2.00 5.50 Hour 13 14 15 16 17 18 19 20 21 22 23 24 5 6 -5 -8 8 7 8 5 8 -5 -2 -1 9 6 4 -5 8 7 13 4 1 7 -4 5 g 8 -5 1 -4 5 6 7 0 1 -7 9 10 -2 0 1 3 6 10 -6 2 7 0 X 7.50 |7.50 -2.00 -3.00 1.75 5.50 8.25 6.50 0.75 1.25 -1.50 3.25