

Answered step by step
Verified Expert Solution
Question
1 Approved Answer
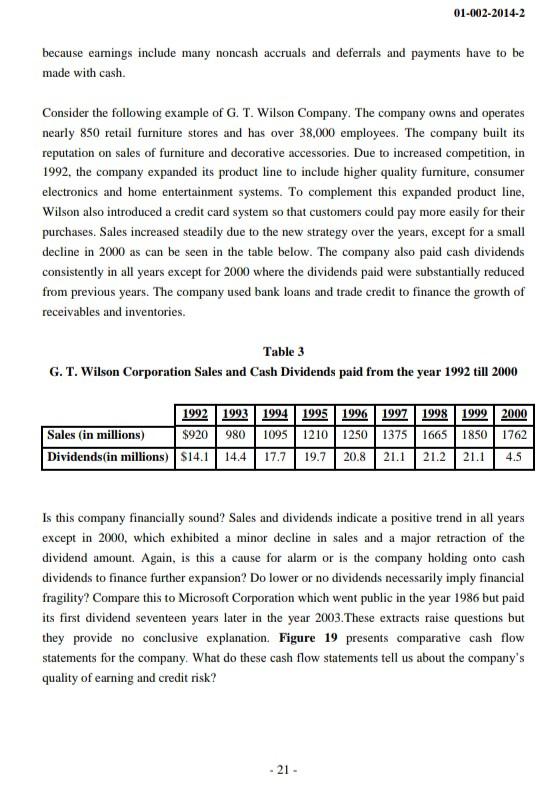
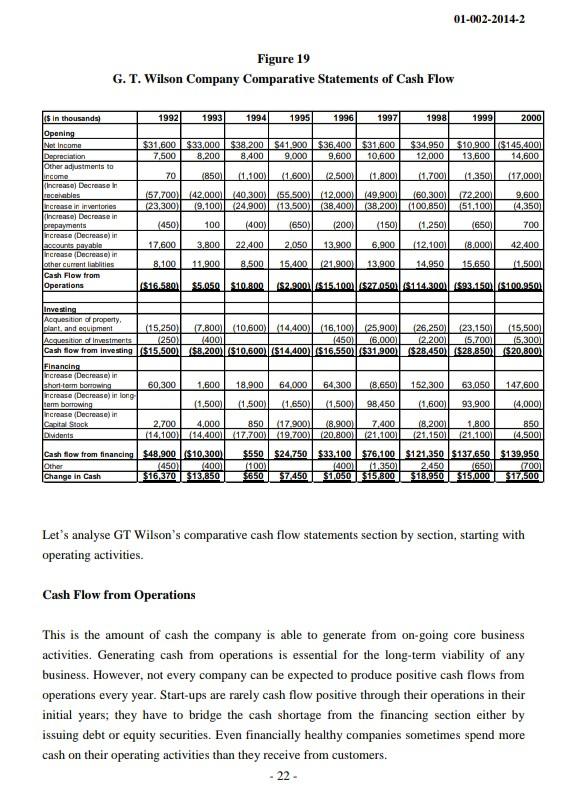
Need detailed SWOT Analysis Of this Case. & 500 Words Overview. STATEMENT OF CASH FLOWS: PREPARATION, ANALYSIS & LINKAGES How was Lucky Cement Limited Company
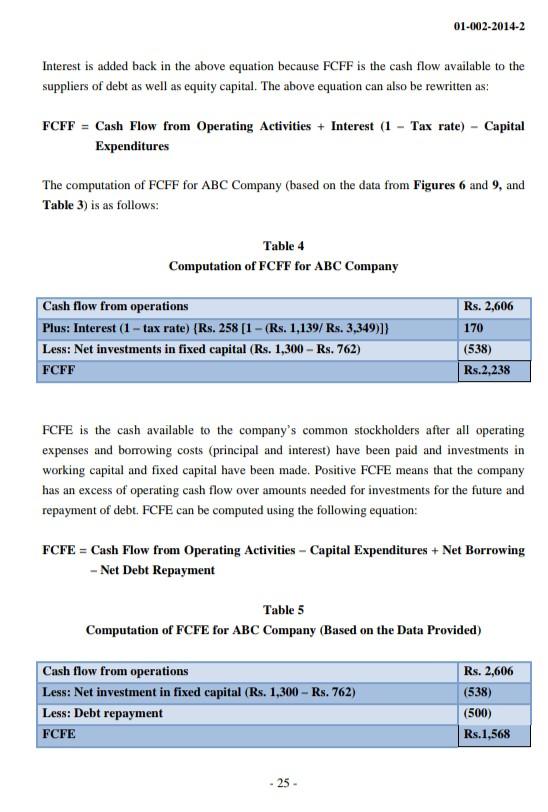
Need detailed SWOT Analysis Of this Case. & 500 Words Overview.
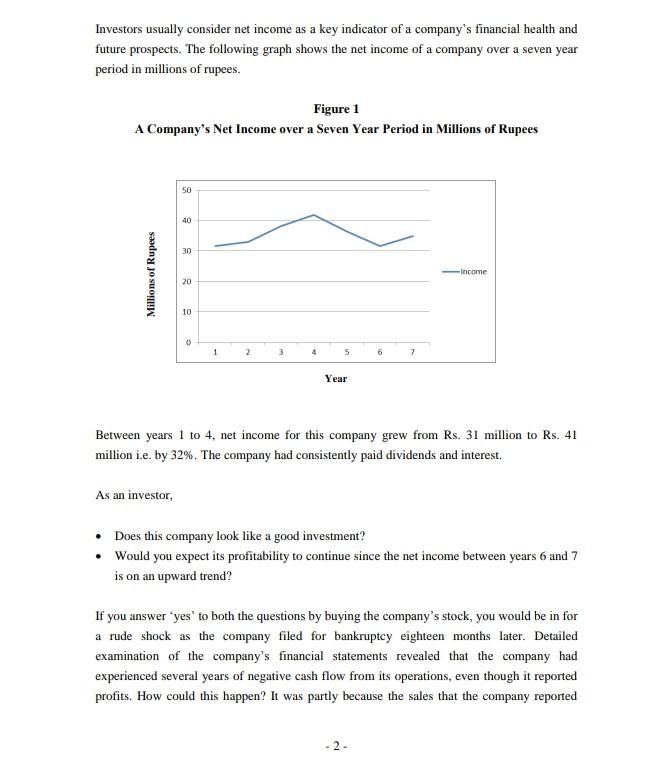
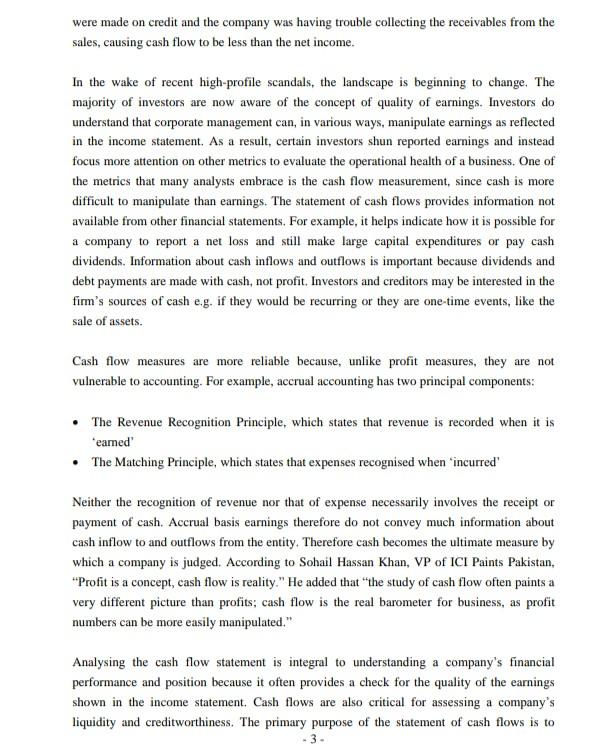
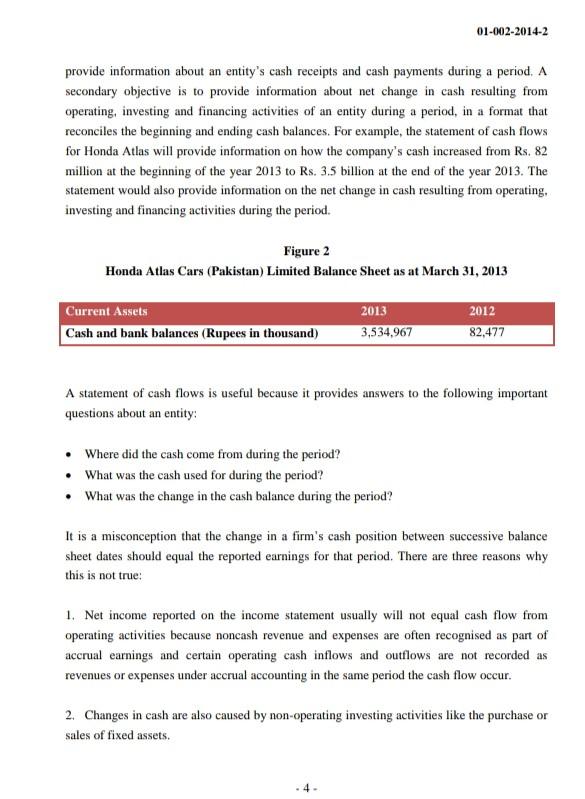
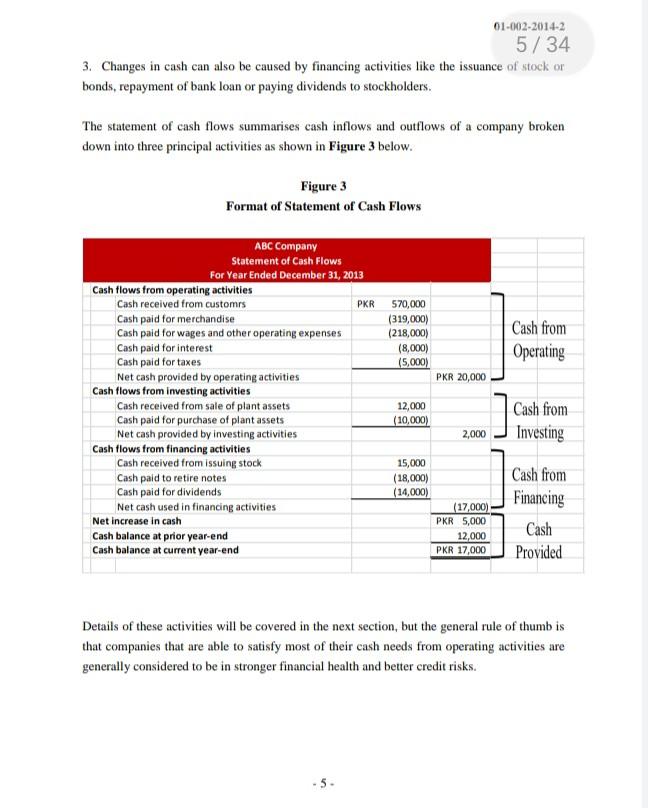
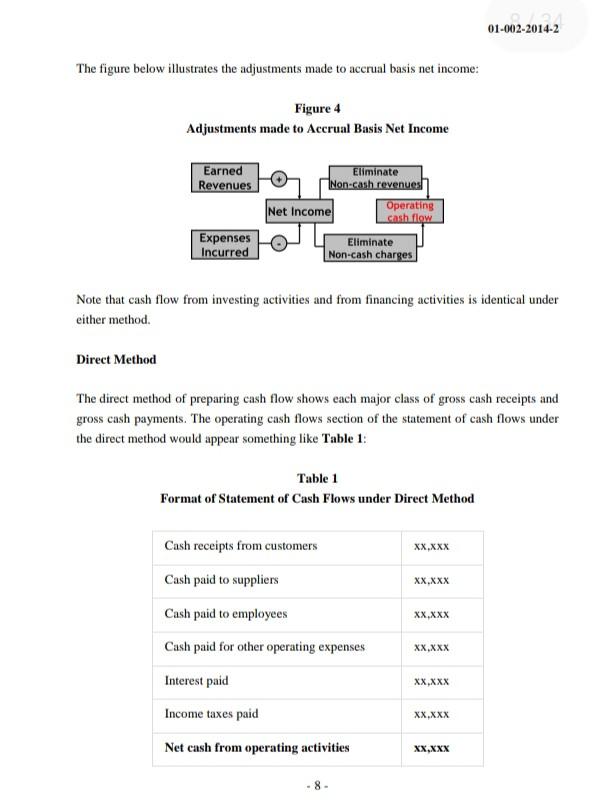
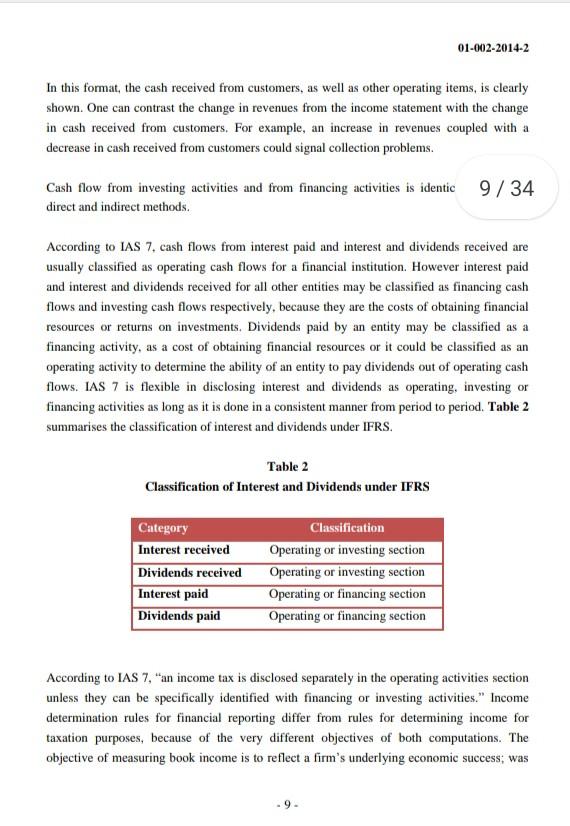
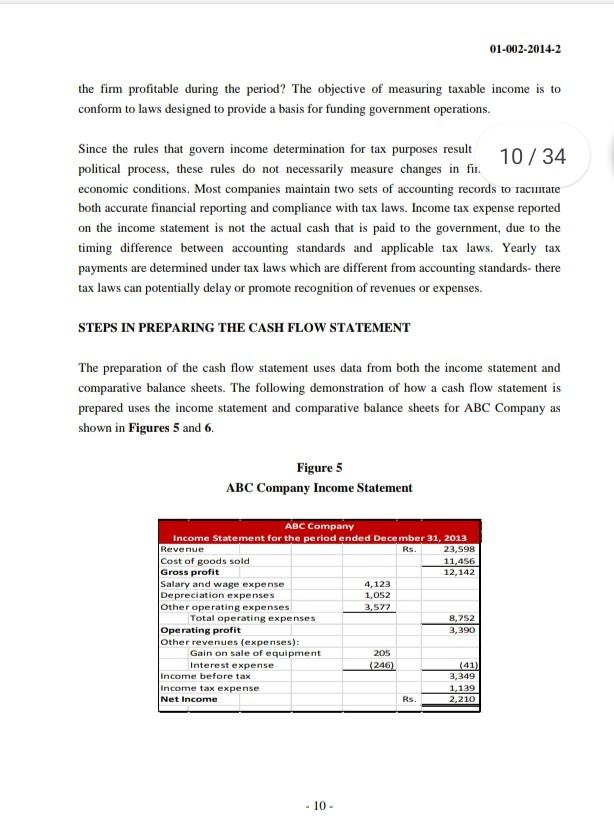
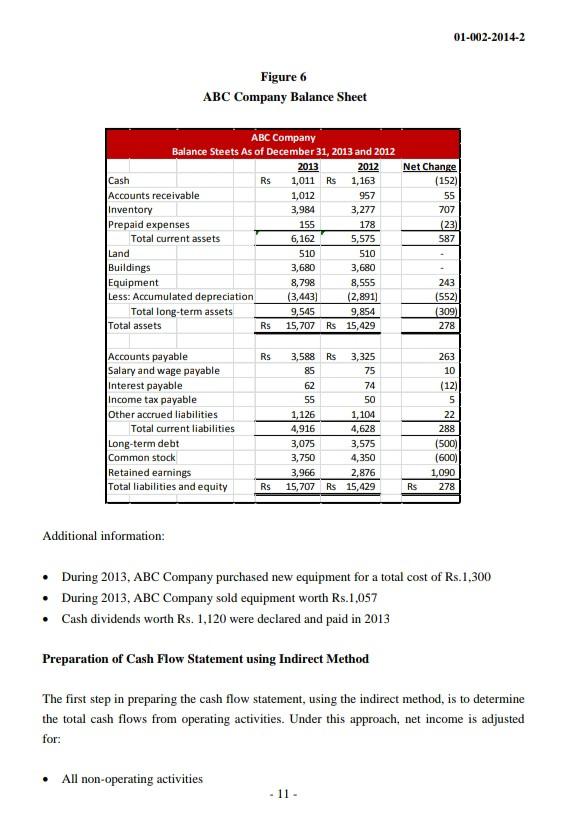
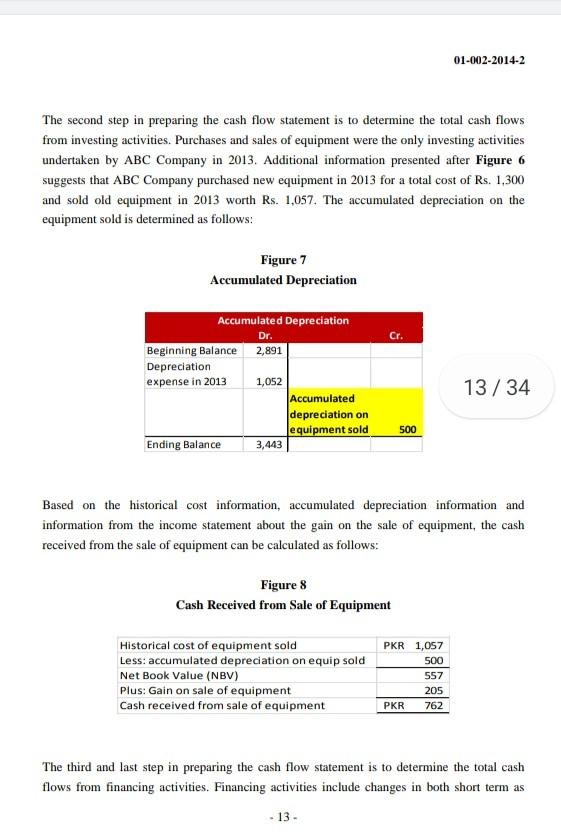
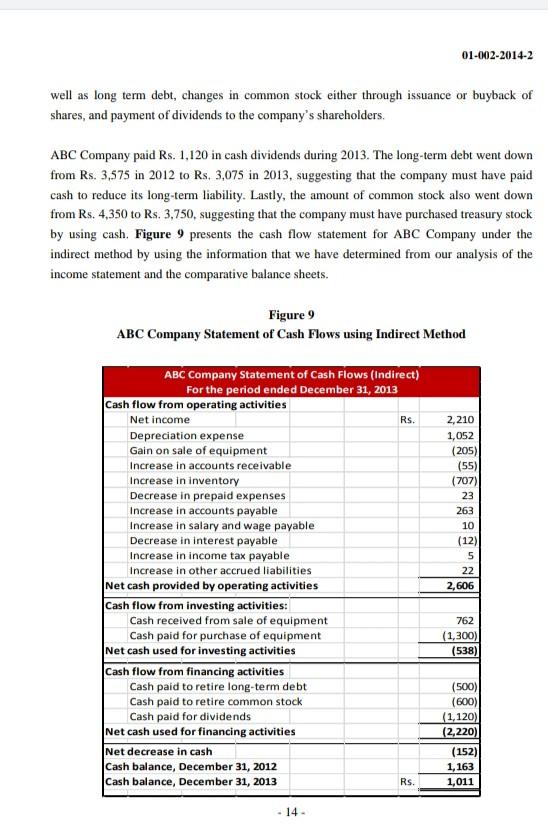
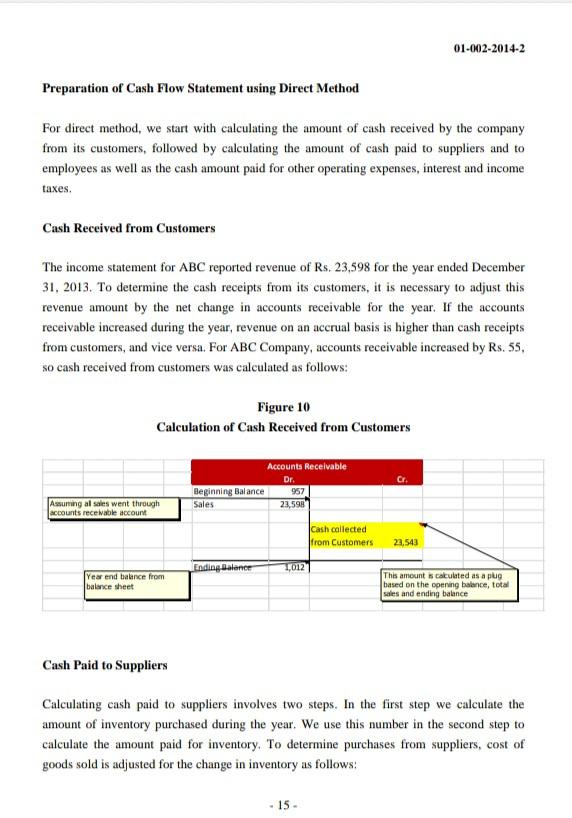
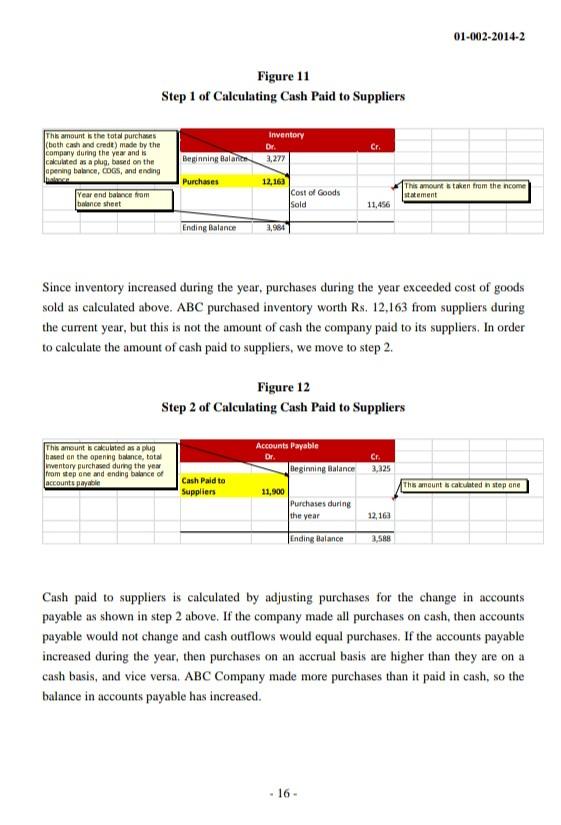
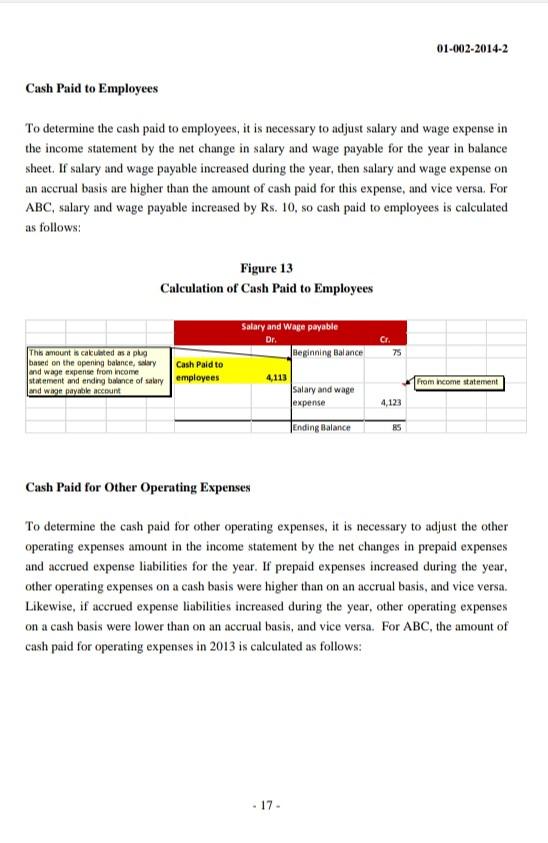
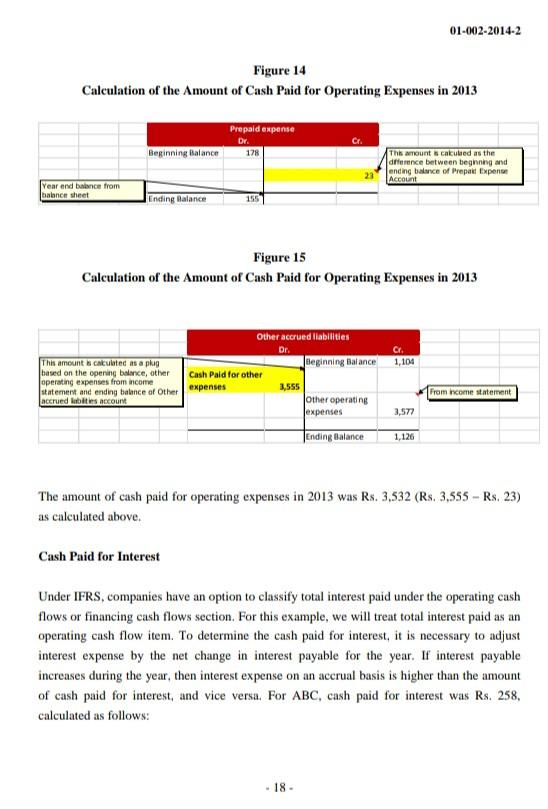
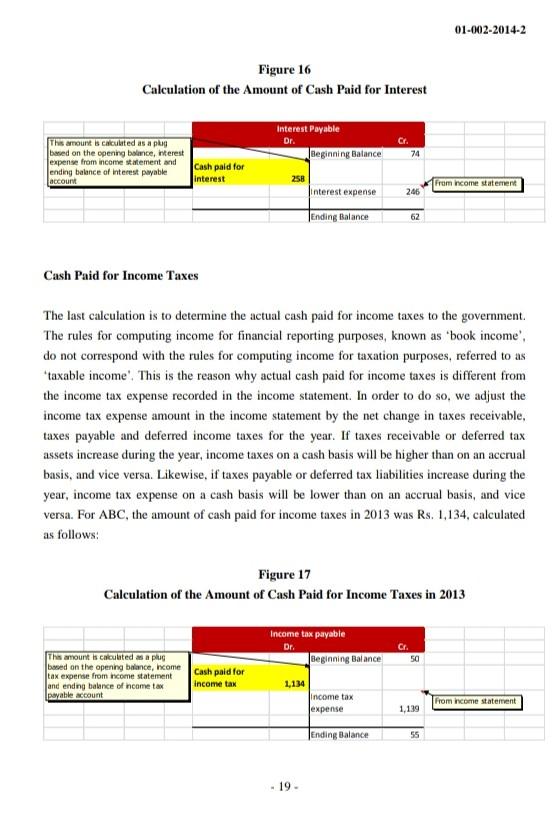
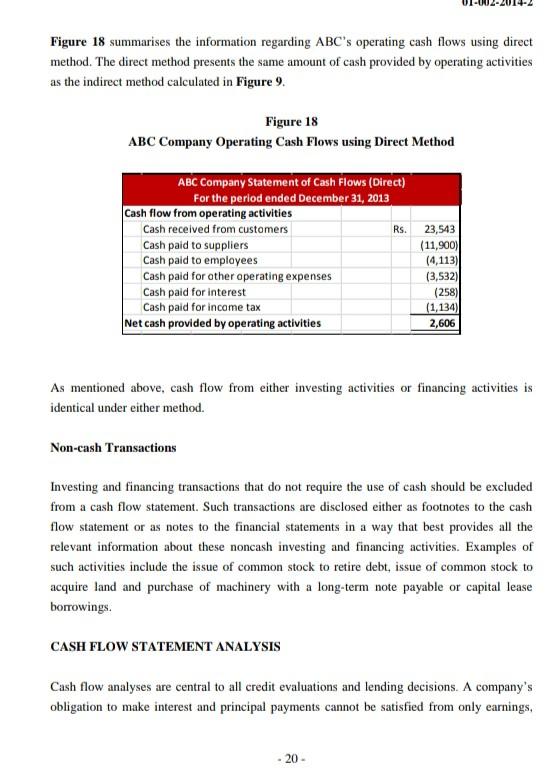
STATEMENT OF CASH FLOWS: PREPARATION, ANALYSIS & LINKAGES How was Lucky Cement Limited Company able to invest Rs. 5.6 billion in a long-term investment while still paying cash dividends of nearly Rs. 2 billion in the year ended 2013? How was the company able to pay back over Rs. 6.5 billion of short and long term debts in the year ended 2012? How did the cash and bank balance account for Honda Atlas Pakistan increase from Rs. 82 million in the March 31, 2012 year-end Statement of Financial Position to Rs. 3.5 billion in the year-end 2013 balance sheet? How was PIA able to invest nearly Rs. 8 billion in property, plant and equipment in 2012 while reporting a net loss of Rs. 33 billion in the same year? Such questions are often asked by those interested in the financial operations of a business enterprise e.g. investors, creditors, top management and board of directors. Balance sheets, income statements and statements of equity often fail to provide answers to these questions; therefore companies are required to prepare a fourth primary financial statement i.e. the statement of cash flows. Commonly referred to as balance sheet. This note was written by Assistant Professor Asad Alam at the Lahore University of Management Sciences to serve as basis for class discussion rather than to illustrate either effective or ineffective handling of an administrative situation. The intent of this note is not to malign or question practices of the cited companies. Questions of scrutiny are raised only for the purpose of academic interest and with scholarly intent. The data has been gathered and analysed with immense diligence and with an aim to represent as valid a picture as possible. This material may not be quoted, photocopied or reproduced in any form without the prior written consent of the Lahore University of Management Sciences. Investors usually consider net income as a key indicator of a company's financial health and future prospects. The following graph shows the net income of a company over a seven year period in millions of rupees. Figure 1 A Company's Net Income over a Seven Year Period in Millions of Rupees 50 40 30 Millions of Rupees -Income 20 10 0 1 2 3 4 5 6 7 Year Between years 1 to 4, net income for this company grew from Rs. 31 million to Rs. 41 million i.e. by 32%. The company had consistently paid dividends and interest. As an investor, Does this company look like a good investment? Would you expect its profitability to continue since the net income between years 6 and 7 is on an upward trend? If you answer 'yes' to both the questions by buying the company's stock, you would be in for a rude shock as the company filed for bankruptcy eighteen months later. Detailed examination of the company's financial statements revealed that the company had experienced several years of negative cash flow from its operations, even though it reported profits. How could this happen? It was partly because the sales that the company reported 2 - were made on credit and the company was having trouble collecting the receivables from the sales, causing cash flow to be less than the net income. In the wake of recent high-profile scandals, the landscape is beginning to change. The majority of investors are now aware of the concept of quality of earnings. Investors do understand that corporate management can, in various ways, manipulate earnings as reflected in the income statement. As a result, certain investors shun reported earnings and instead focus more attention on other metrics to evaluate the operational health of a business. One of the metrics that many analysts embrace is the cash flow measurement, since cash is more difficult to manipulate than earnings. The statement of cash flows provides information not available from other financial statements. For example, it helps indicate how it is possible for a company to report a net loss and still make large capital expenditures or pay cash dividends. Information about cash inflows and outflows is important because dividends and debt payments are made with cash, not profit. Investors and creditors may be interested in the firm's sources of cash e.g. if they would be recurring or they are one-time events, like the sale of assets. Cash flow measures are more reliable because, unlike profit measures, they are not vulnerable to accounting. For example, accrual accounting has two principal components: The Revenue Recognition Principle, which states that revenue is recorded when it is eamed The Matching Principle, which states that expenses recognised when "incurred' Neither the recognition of revenue nor that of expense necessarily involves the receipt or payment of cash. Accrual basis earnings therefore do not convey much information about cash inflow to and outflows from the entity. Therefore cash becomes the ultimate measure by which a company is judged. According to Sohail Hassan Khan, VP of ICI Paints Pakistan, "Profit is a concept, cash flow is reality." He added that "the study of cash flow often paints a very different picture than profits; cash flow is the real barometer for business, as profit numbers can be more easily manipulated." Analysing the cash flow statement is integral to understanding a company's financial performance and position because it often provides a check for the quality of the earnings shown in the income statement. Cash flows are also critical for assessing a company's liquidity and creditworthiness. The primary purpose of the statement of cash flows is to - 3 - 01-002-2014-2 5/34 3. Changes in cash can also be caused by financing activities like the issuance of stock or bonds, repayment of bank loan or paying dividends to stockholders. The statement of cash flows summarises cash inflows and outflows of a company broken down into three principal activities as shown in Figure 3 below. Figure 3 Format of Statement of Cash Flows 570,000 (319,000) (218,000) (8,000) (5,000) Cash from Operating PKR 20,000 ABC Company Statement of Cash Flows For Year Ended December 31, 2013 Cash flows from operating activities Cash received from customs PKR Cash paid for merchandise Cash paid for wages and other operating expenses Cash paid for interest Cash paid for taxes Net cash provided by operating activities Cash flows from investing activities Cash received from sale of plant assets Cash paid for purchase of plant assets Net cash provided by investing activities Cash flows from financing activities Cash received from issuing stock Cash paid to retire notes Cash paid for dividends Net cash used in financing activities Net increase in cash Cash balance at prior year-end Cash balance at current year-end 12,000 (10,000) Cash from Investing 2,000 15,000 (18,000) (14,000) (17,000) PKR 5,000 12,000 PKR 17,000 Cash from Financing Cash Provided Details of these activities will be covered in the next section, but the general rule of thumb is that companies that are able to satisfy most of their cash needs from operating activities are generally considered to be in stronger financial health and better credit risks. .5. CLASSIFICATION OF CASH FLOWS Statement of Cash Flows is covered under International Accounting Standard 7 (IAS 7). which requires an entity to present a statement of cash flows as an integral part of its primary financial statements, along with Balance Sheet, Income Statement and Statement of Changes in Shareholders' Equity, IAS 7 defines cash equivalents as "short-term, highly liquid investments that are readily convertible to known amounts of cash and which are subject to an insignificant risk of changes in value." Script from IAS 7 covering the definition of Cash and Cash equivalents is stated in Appendix 1. According to IAS 7. "The statement of cash flows analyses changes in cash and cash equivalents during a period, Cash and cash equivalents comprise cash on hand and demand deposits, together with short-term, highly liquid investments that are readily convertible to a known amount of cash and that are subject to an insignificant risk of changes in value. An investment normally meets the definition of a cash equivalent when it has a maturity of three months or less from the date of acquisition 2 The statement of cash flows classifies cash receipts and cash payments by operating, investing and financing activities. Operating activities are revenue producing activities, for example, cash receipts from customers for sale of goods and rendering of services, or cash payments to suppliers for goods and services and employees. These are the core activities of a business contextualised by what is the operative scope of the business and determine the profit or loss of an entity, For example, in a company like Unilever, cash flows related to sale of Surf Excel detergent and Clear shampoo will be classified as operating cash flows but the loss on sale of its Walls ice-cream division will not be considered as operating cash flows. Investing activities are the acquisition and disposal of long-term assets and investments c.g, cash payments to acquire fixed assets. These activities need to be analysed as they represent future income and cash flows potential International Accounting Standard 7 Financing activities result in changes in the size and composition of the equity capital and borrowings of the entity, for example, cash proceeds from issue of shares, debentures, loans, notes, bonds, mortgages and other short or long-term borrowings. REPORTING CASH FLOWS FROM OPERATING ACTIVITIES An entity can report cash flows from operating activities using either: Direct method Indirect method Indirect Method The indirect method, also called the balance sheet method, shows how cash flow from operations can be calculated from reported net income as the result of a series of adjustments made for items that affected net income but did not affect cash. The indirect method begins with net income. To reconcile net income with operating cash flow, the following adjustments are made to the net income Items are included in net income that did not affect cash in the current period such as: o Noncash revenues or gains (e.g. accounts receivable and gains on disposal of fixed assets); Noncash expenses or losses (e.g. depreciation and amortisation, provision for bad debt expense and expenses recorded in income statement but not paid in cash). Items are excluded from net income that did affect operating cash flows in the current period, such as: o Cash inflows (revenues) received but not recognised as earned in the current period (e.g. prepaid rent and collections on accounts receivable): o Cash outflows (expenses) paid but not recognised for accrual purposes in the current period (e.g. prepaid insurance and payments on accounts payable). 01-002-2014-2 The figure below illustrates the adjustments made to accrual basis net income: Figure 4 Adjustments made to Accrual Basis Net Income Earned Eliminate Revenues Non-cash revenues Net Income Operating cash flow Expenses Eliminate Incurred Non-cash charges Note that cash flow from investing activities and from financing activities is identical under either method. Direct Method The direct method of preparing cash flow shows each major class of gross cash receipts and gross cash payments. The operating cash flows section of the statement of cash flows under the direct method would appear something like Table 1: Table 1 Format of Statement of Cash Flows under Direct Method Cash receipts from customers XX.XXX Cash paid to suppliers XX.XXX Cash paid to employees XX.XXX Cash paid for other operating expenses XX.XXX Interest paid XX.XXX Income taxes paid XX.XXX Net cash from operating activities XX.XXX 8- 01-002-2014-2 In this format, the cash received from customers, as well as other operating items, is clearly shown. One can contrast the change in revenues from the income statement with the change in cash received from customers. For example, an increase in revenues coupled with a decrease in cash received from customers could signal collection problems. Cash flow from investing activities and from financing activities is identic 9/34 direct and indirect methods. According to IAS 7. cash flows from interest paid and interest and dividends received are usually classified as operating cash flows for a financial institution. However interest paid and interest and dividends received for all other entities may be classified as financing cash flows and investing cash flows respectively, because they are the costs of obtaining financial resources or returns on investments. Dividends paid by an entity may be classified as a financing activity, as a cost of obtaining financial resources or it could be classified as an operating activity to determine the ability of an entity to pay dividends out of operating cash flows. IAS 7 is flexible in disclosing interest and dividends as operating, investing or financing activities as long as it is done in a consistent manner from period to period. Table 2 summarises the classification of interest and dividends under IFRS. Table 2 Classification of Interest and Dividends under IFRS Category Interest received Dividends received Interest paid Dividends paid Classification Operating or investing section Operating or investing section Operating or financing section Operating or financing section According to IAS 7, "an income tax is disclosed separately in the operating activities section unless they can be specifically identified with financing or investing activities." Income determination rules for financial reporting differ from rules for determining income for taxation purposes, because of the very different objectives of both computations. The objective of measuring book income is to reflect a firm's underlying economic success, was 9. 01-002-2014-2 the fimm profitable during the period? The objective of measuring taxable income is to conform to laws designed to provide a basis for funding government operations. Since the rules that govern income determination for tax purposes result 10/34 political process, these rules do not necessarily measure changes in fit. economic conditions. Most companies maintain two sets of accounting records to racitate both accurate financial reporting and compliance with tax laws. Income tax expense reported on the income statement is not the actual cash that is paid to the government, due to the timing difference between accounting standards and applicable tax laws. Yearly tax payments are determined under tax laws which are different from accounting standards- there tax laws can potentially delay or promote recognition of revenues or expenses. STEPS IN PREPARING THE CASH FLOW STATEMENT The preparation of the cash flow statement uses data from both the income statement and comparative balance sheets. The following demonstration of how a cash flow statement is prepared uses the income statement and comparative balance sheets for ABC Company as shown in Figures 5 and 6. Figure 5 ABC Company Income Statement ABC Company Income Statement for the period ended December 31, 2013 Revenue Rs. 23,598 Cost of goods sold 11,456 Gross profit 12,142 Salary and wage expense 4,123 Depreciation expenses 1,052 Other operating expenses 3,572 Total operating expenses 8,752 Operating profit 3,390 Other revenues (expenses): Gain on sale of equipment 205 Interest expense (246) (41) income before tax 3,349 Income tax expense 1,139 Net Income Rs. 2,210 - 10 - 01-002-2014-2 Figure 6 ABC Company Balance Sheet 957 ABC Company Balance Steets As of December 31, 2013 and 2012 2013 2012 Cash Rs 1,011 Rs 1,163 Accounts receivable 1,012 Inventory 3,984 3,277 Prepaid expenses 155 178 Total current assets 6,162 5,575 Land 510 510 Buildings 3,680 3,680 Equipment 8,798 8,555 Less: Accumulated depreciation (3,443] (2,891) Total long-term assets 9,545 9,854 Total assets Rs 15,707 Rs 15,429 Net Change (152) 55 707 (23) 587 243 (552) (309) 278 Rs Accounts payable Salary and wage payable interest payable Income tax payable Other accrued liabilities Total current liabilities Long-term debt Common stock Retained earnings Total liabilities and equity 3,588 RS 3,325 85 75 62 74 55 50 1,126 1,104 4,916 4,628 3,075 3,575 3,750 4,350 3,966 2,876 15,707 Rs 15,429 263 10 (12) 5 22 288 (500) (600) 1,090 278 Rs Rs Additional information: During 2013, ABC Company purchased new equipment for a total cost of Rs.1,300 During 2013, ABC Company sold equipment worth Rs.1,057 Cash dividends worth Rs. 1,120 were declared and paid in 2013 Preparation of Cash Flow Statement using Indirect Method The first step in preparing the cash flow statement, using the indirect method, is to determine the total cash flows from operating activities. Under this approach, net income is adjusted for: . All non-operating activities -11- 01-002-2014-2 All noncash expenses Changes in operating working capital The sale of equipment resulting in a gain of Rs. 205 is the only non-operating activity in ABC's income statement. This amount is removed from the operating cash flow since sale of property, plant and equipment is considered an investing activity and the cash effects of the sale are shown in the investing section of cash flow statement. Depreciation expense is a noncash expense, which needs to be added back to the net income because it was a noncash deduction in the calculation of net income. Changes in working capital accounts include increases and decreases in the current operating asset and liability accounts. Changes in these accounts arise from applying accrual accounting i.e. recognising revenues when they are earned and expenses when they are incurred instead of when the cash is received or paid. Under the indirect method, all increases in the current operating asset accounts are subtracted from net income while all decreases are added to net income. For example, the increase in accounts receivable illustrated in Figure 6 from Rs.957 in 2012 to Rs.1,012 in 2013 resulted in a net increase of Rs.55. This amount was part of the revenue recorded in the income statement but the corresponding cash was not received from customers; therefore, to reconcile, Rs. 55 must be deducted from net income as illustrated in Figure 9. In contrast to current operating assets, an increase in current operating liabilities is added to net income while a net decrease is subtracted from net income. For example, the increase in accounts payable from Rs. 3,325 in 2012 to Rs. 3,588 resulted in an increase of Rs. 263. which must be added back to net income as illustrated in Figure 9. We add net increase in current operating liabilities back to net income, because it results from recording higher expenses in income statement as compared to the amount of cash paid for these expenses. Figure 9 illustrates all the net changes in current operating liabilities added or subtracted from net income of ABC Company. The Rs. 55 increase in accounts receivable and the Rs.707 increase in inventory are subtracted from net income while the Rs. 23 decrease in prepaid expenses is added to net income. On the current liability side, the increases in accounts payable, salary and wage payable, income tax payable and other accrued liabilities are added to net income while the decrease in interest payable is subtracted from net income. - 12- 01-002-2014-2 The second step in preparing the cash flow statement is to determine the total cash flows from investing activities. Purchases and sales of equipment were the only investing activities undertaken by ABC Company in 2013. Additional information presented after Figure 6 suggests that ABC Company purchased new equipment in 2013 for a total cost of Rs. 1,300 and sold old equipment in 2013 worth Rs. 1,057. The accumulated depreciation on the equipment sold is determined as follows: Figure 7 Accumulated Depreciation Cr. Accumulated Depreciation Dr. Beginning Balance 2,891 Depreciation expense in 2013 1,052 Accumulated depreciation on equipment sold Ending Balance 3,443 13/ 34 500 Based on the historical cost information, accumulated depreciation information and information from the income statement about the gain on the sale of equipment, the cash received from the sale of equipment can be calculated as follows: Figure 8 Cash Received from Sale of Equipment Historical cost of equipment sold Less: accumulated depreciation on equip sold Net Book Value (NBV) Plus: Gain on sale of equipment Cash received from sale of equipment PKR 1,057 500 557 205 PKR 762 The third and last step in preparing the cash flow statement is to determine the total cash flows from financing activities. Financing activities include changes in both short term as - 13 01-002-2014-2 well as long term debt, changes in common stock either through issuance or buyback of shares, and payment of dividends to the company's shareholders. ABC Company paid Rs. 1,120 in cash dividends during 2013. The long-term debt went down from Rs. 3,575 in 2012 to Rs. 3,075 in 2013, suggesting that the company must have paid cash to reduce its long-term liability. Lastly, the amount of common stock also went down from Rs. 4,350 to Rs. 3,750, suggesting that the company must have purchased treasury stock by using cash. Figure 9 presents the cash flow statement for ABC Company under the indirect method by using the information that we have determined from our analysis of the income statement and the comparative balance sheets. Figure 9 ABC Company Statement of Cash Flows using Indirect Method Rs. ABC Company Statement of Cash Flows (Indirect) For the period ended December 31, 2013 Cash flow from operating activities Net income Depreciation expense Gain on sale of equipment Increase in accounts receivable Increase in inventory Decrease in prepaid expenses Increase in accounts payable Increase in salary and wage payable Decrease in interest payable Increase in income tax payable Increase in other accrued liabilities Net cash provided by operating activities Cash flow from investing activities: Cash received from sale of equipment Cash paid for purchase of equipment Net cash used for investing activities Cash flow from financing activities Cash paid to retire long-term debt Cash paid to retire common stock Cash paid for dividends Net cash used for financing activities Net decrease in cash Cash balance, December 31, 2012 Cash balance, December 31, 2013 Rs. 2,210 1,052 (205) (55) (707) 23 263 10 (12) 5 22 2,606 762 (1,300) (538) (500) (600) (1,120 (2,220) (152) 1,163 1,011 01-002-2014-2 Preparation of Cash Flow Statement using Direct Method For direct method, we start with calculating the amount of cash received by the company from its customers, followed by calculating the amount of cash paid to suppliers and to employees as well as the cash amount paid for other operating expenses, interest and income taxes. Cash Received from Customers The income statement for ABC reported revenue of Rs. 23,598 for the year ended December 31, 2013. To determine the cash receipts from its customers, it is necessary to adjust this revenue amount by the net change in accounts receivable for the year. If the accounts receivable increased during the year, revenue on an accrual basis is higher than cash receipts from customers, and vice versa. For ABC Company, accounts receivable increased by Rs. 55, so cash received from customers was calculated as follows: Figure 10 Calculation of Cash Received from Customers CE Accounts Receivable Dr. Beginning Balance 957 Sales 23,598 Asuming al sales went through accounts recewable account Cash collected from Customers 2,543 Ending Balance 1,012 Year end balance from balance sheet This amount is calculated as a plug based on the opening balance, total sales and ending balance Cash Paid to Suppliers Calculating cash paid to suppliers involves two steps. In the first step we calculate the amount of inventory purchased during the year. We use this number in the second step to calculate the amount paid for inventory. To determine purchases from suppliers, cost of goods sold is adjusted for the change in inventory as follows: 15. 01-002-2014-2 Figure 11 Step 1 of Calculating Cash Paid to Suppliers Inventory Dr. 2,277 Beginning Balaren The amount is the total purchases (both cash and credt) made by the comparty during the year and is calculated as a plug, based on the opening balance, COGS, and ending Inc Year end balance from balance sheet Purchases 12,163 Cost of Goods Sold This amount staken from the income statement Ending Balance 2,984 Since inventory increased during the year, purchases during the year exceeded cost of goods sold as calculated above. ABC purchased inventory worth Rs. 12,163 from suppliers during the current year, but this is not the amount of cash the company paid to its suppliers. In order to calculate the amount of cash paid to suppliers, we move to step 2. Figure 12 Step 2 of Calculating Cash Paid to Suppliers This amount calculated as a plug based on the opening balance, totul nventory purchased during the you From step one and ending balance of accounts payable Accounts Payable Dr. Beginning Balance Cash Paid to Suppliers This amount calculated in step ane 11,900 Purchases during the year 12,163 inding balance 3,588 Cash paid to suppliers is calculated by adjusting purchases for the change in accounts payable as shown in step 2 above. If the company made all purchases on cash, then accounts payable would not change and cash outflows would equal purchases. If the accounts payable increased during the year, then purchases on an accrual basis are higher than they are on a cash basis, and vice versa. ABC Company made more purchases than it paid in cash, so the balance in accounts payable has increased. - 16- 01-002-2014-2 Cash Paid to Employees To determine the cash paid to employees, it is necessary to adjust salary and wage expense in the income statement by the net change in salary and wage payable for the year in balance sheet. If salary and wage payable increased during the year, then salary and wage expense on an accrual basis are higher than the amount of cash paid for this expense, and vice versa. For ABC, salary and wage payable increased by Rs. 10, so cash paid to employees is calculated as follows: Figure 13 Calculation of Cash Paid to Employees Salary and Wage payable Dr. Beginning Balance The amount is caused as a plug based on the opening balance, y Cash Paid to and wage expense from income statement and endng balance of salary employees and wage payabile necount From income statement 4,113 Salary and Wage expense 4,123 Ending Balance BS Cash Paid for Other Operating Expenses To determine the cash paid for other operating expenses, it is necessary to adjust the other operating expenses amount in the income statement by the net changes in prepaid expenses and accrued expense liabilities for the year. If prepaid expenses increased during the year, other operating expenses on a cash basis were higher than on an accrual basis, and vice versa. Likewise, if accrued expense liabilities increased during the year, other operating expenses on a cash basis were lower than on an accrual basis, and vice versa. For ABC, the amount of cash paid for operating expenses in 2013 is calculated as follows: - 17 - 01-002-2014-2 Figure 14 Calculation of the Amount of Cash Paid for Operating Expenses in 2013 Prepaid expense Dr. 178 Beginning Balance This amount calculed as the difference between beginning and ending balance of Prepakt Expense Account Year end bance from balance sheet Ending Balance Figure 15 Calculation of the Amount of Cash Paid for Operating Expenses in 2013 1,104 This amount calculated as a plug based on the opening balance, other operating expenses from income statement and ending balance of Other accrued abilities accou Other accrued liabilities Dr. Beginning Balance Cash Paid for other expenses 3,555 other operating expenses From income statement 3,577 Ending Balance 1,126 The amount of cash paid for operating expenses in 2013 was Rs. 3,532 (Rs. 3,555 - Rs. 23) as calculated above. Cash Paid for Interest Under IFRS, companies have an option to classify total interest paid under the operating cash flows or financing cash flows section. For this example, we will treat total interest paid as an operating cash flow item. To determine the cash paid for interest, it is necessary to adjust interest expense by the net change in interest payable for the year. If interest payable increases during the year, then interest expense on an accrual basis is higher than the amount of cash paid for interest, and vice versa. For ABC, cash paid for interest was Rs. 258, calculated as follows: 18 - 01-002-2014-2 Figure 16 Calculation of the Amount of Cash Paid for Interest Interest Payable Dr. Beginning Balance This amount is crcuted as a plug based on the opening balance, interest expense from income statement and ending balance of interest payable account 74 Cash paid for interest 258 Interest expense From income statement 246 Ending Balance 62 Cash Paid for Income Taxes The last calculation is to determine the actual cash paid for income taxes to the government. The rules for computing income for financial reporting purposes, known as book income', do not correspond with the rules for computing income for taxation purposes, referred to as "taxable income'. This is the reason why actual cash paid for income taxes is different from the income tax expense recorded in the income statement. In order to do so, we adjust the income tax expense amount in the income statement by the net change in taxes receivable, taxes payable and deferred income taxes for the year. If taxes receivable or deferred tax assets increase during the year, income taxes on a cash basis will be higher than on an accrual basis, and vice versa. Likewise, if taxes payable or deferred tax liabilities increase during the year, income tax expense on a cash basis will be lower than on an accrual basis, and vice versa. For ABC, the amount of cash paid for income taxes in 2013 was Rs. 1,134, calculated as follows: Figure 17 Calculation of the Amount of Cash Paid for Income Taxes in 2013 Income tax payable Dr. Beginning Balance 50 The amount is calculated as a plug based on the opening balance, Income tax expense from come statement and ending balance of ncome tax payable account Cash paid for income tax 1,134 income tax expense From income statement 1,139 Ending Balance 55 - 19 Figure 18 summarises the information regarding ABC's operating cash flows using direct method. The direct method presents the same amount of cash provided by operating activities as the indirect method calculated in Figure 9. Figure 18 ABC Company Operating Cash Flows using Direct Method ABC Company Statement of Cash Flows (Direct) For the period ended December 31, 2013 Cash flow from operating activities Cash received from customers Rs. Cash paid to suppliers Cash paid to employees Cash paid for other operating expenses Cash paid for interest Cash paid for income tax Net cash provided by operating activities 23,543 (11,900) (4,113) (3,532) (258) (1,134) 2,606 As mentioned above, cash flow from either investing activities or financing activities is identical under either method. Non-cash Transactions Investing and financing transactions that do not require the use of cash should be excluded from a cash flow statement. Such transactions are disclosed either as footnotes to the cash flow statement or as notes to the financial statements in a way that best provides all the relevant information about these noncash investing and financing activities. Examples of such activities include the issue of common stock to retire debt, issue of common stock to acquire land and purchase of machinery with a long-term note payable or capital lease borrowings. CASH FLOW STATEMENT ANALYSIS Cash flow analyses are central to all credit evaluations and lending decisions. A company's obligation to make interest and principal payments cannot be satisfied from only earnings, 20- 01-002-2014-2 because eamings include many noncash accruals and deferrals and payments have to be made with cash. Consider the following example of G. T. Wilson Company. The company owns and operates nearly 850 retail furniture stores and has over 38.000 employees. The company built its reputation on sales of furniture and decorative accessories. Due to increased competition, in 1992, the company expanded its product line to include higher quality fumiture, consumer electronics and home entertainment systems. To complement this expanded product line, Wilson also introduced a credit card system so that customers could pay more easily for their purchases. Sales increased steadily due to the new strategy over the years, except for a small decline in 2000 as can be seen in the table below. The company also paid cash dividends consistently in all years except for 2000 where the dividends paid were substantially reduced from previous years. The company used bank loans and trade credit to finance the growth of receivables and inventories. Table 3 G. T. Wilson Corporation Sales and Cash Dividends paid from the year 1992 till 2000 1992 1993 1994 1995 1996 1997 1998 1999 2000 Sales (in millions) $920 980 1095 1210 1250 1375 1665 1850 1762 Dividends(in millions) $14.1 14.4 17.7 19.7 20.8 21.1 21.2 21.1 4.5 Is this company financially sound? Sales and dividends indicate a positive trend in all years except in 2000, which exhibited a minor decline in sales and a major retraction of the dividend amount. Again, is this a cause for alarm or is the company holding onto cash dividends to finance further expansion? Do lower or no dividends necessarily imply financial fragility? Compare this to Microsoft Corporation which went public in the year 1986 but paid its first dividend seventeen years later in the year 2003. These extracts raise questions but they provide no conclusive explanation Figure 19 presents comparative cash flow statements for the company. What do these cash flow statements tell us about the company's quality of earning and credit risk? 21 - 01-002-2014-2 Figure 19 G.T. Wilson Company Comparative Statements of Cash Flow 1992 1993 1994 1995 1996 1997 1998 1999 2000 $34,950 $10,900 $145,400) 12,000 13,600 14,600 (1.700 (1.350 (17,000) ($ in thousands Opening Not Income Depreciation Other adjustments to Income Increasej Decrease in rochables Increase in invertories increase] Decrease in prepayments increase (Decrease) in accounts payable Increase (Decrease in other current liabilities Cash Flow from Operations $31,600 $33,000 $38.200 $41.900 $36,400 $31,600 7,500 8,200 8.400 9.000 9,600 10,600 70 (850) (1.100) (1.600) (2.500) (1.800) (57.700) (42,000 (40,300) (55.500) (12.000) (49.900) (23,300) (9,100 24.900 13.500) (38,400 (38,200) (450) 100 (400) (650) (200) (150) 17,600 3,800 22.400 2.050 13.900 6.900 60,300 (100,850) 72.2001 (51.100) 9.600 (4,350) (1,250) (650) 700 (12.100) (8,000) 42.400 8.100 11.900 8.500 15.400 (21.900) 13,900 14.950 15,650 11.500) $16.5801 $5.050 $10.800 152.900 | 51510011 270505114390593,150 $100,9501 (26,250) (23,150) (15,500) (2.2008 15.700) 15.300) ($28,450 ($28,850) ($20,800 Investing Acquesition of property plant, and equipment (15,250) 7.800 (10,600) (14,400) (16.100 125,900) Acquesition of Investments (250) 14001 (450) (6,000) Cash flow from Investing ($15.500 ($8,200 $10.600|(14.400($16.5501($31.900) Financing increase (Decrease in short-term bonowing 60,300 1,600 18.900 64.000 64,300 (8,650) increase (Decrease) in long term borrowing (1,500) (1,500) (1.650) (1,500) 98.450 increase (Decrease in Capital Stock 2,700 4,000 850 (17.900) (8,900) 7.400 Diwdents (14,100 14.40017.700(19.700) 120.800) 121.100 152.300 63,050 147,600 (1,600) 93,900 (4,000) 18.2001 (21.150) 1,800 (21.100) 850 14,5001 Cash flow from financing $48.900 $10,300) Other (450) (400) Change in Cash 516,370 $13,850 $550 $24.750 $33.100 $76,100 $121,350 $137.6505139.950 (100) (400) (1,350) 2,450 (650) (700) $650 $7.450 $1.050515.800 $18.950 $115.000 $17.500 Let's analyse GT Wilson's comparative cash flow statements section by section, starting with operating activities. Cash Flow from Operations This is the amount of cash the company is able to generate from on-going core business activities. Generating cash from operations is essential for the long-term viability of any business. However, not every company can be expected to produce positive cash flows from operations every year. Start-ups are rarely cash flow positive through their operations in their initial years, they have to bridge the cash shortage from the financing section either by issuing debt or equity securities. Even financially healthy companies sometimes spend more cash on their operating activities than they receive from customers. - 22- 01-002-2014-2 The three most important items in operating sections are inventory, receivables and payable management. In all the years with the exception of the year 2000, the net change in receivables has remained negative which means that the firm has been slow to collect cash from it debtors and/or made an increasing amount of sales on credit. Likewise, the inventory too has served as a cash outflow, with the firm holding onto increasing amounts of inventory in each and every year, perhaps encouraged by its annual growth in sales. The net change in accounts payable has ballooned over the years, suggesting the company did not have cash to pay its suppliers. Figure 19 shows that the primary factors contributing to the company's negative operating cash flows are increases in accounts receivable and inventories. Some growth in receivables and inventories is to be expected because of the company's decision to expand its product line and to introduce a customer credit card. However, the increase shown in Figure 19 signals expanded credit card use and lenient credit policies toward customers. Similarly, increase in inventories may signal escalating merchandise costs or reduced customer demand for company's product Notice that net income was positive in all years except 2000 (loss of $145,000) whilst cash flows from operations became negative much earlier on (from the year 1995 all the way till 2000), signifying that the quality of earnings was rather poor. Poor quality earnings are those derived from non-core operations or from accounting estimate adjustments. In the case of GT Wilson, it seems that the poor quality earnings eventually transmuted into overall losses. Since G. T. Wilson Company spent more cash on its operating activities than it generated, the company must find ways to finance the operating cash shortfall. This means using cash reserves (if the company has any), borrowing additional cash, issuing additional equity, or liquidating investment like real estate and other fixed asset. None of these options can be sustained for prolonged periods of time. Cash Flow from Investing Activities This section discloses G. T. Wilson Company's capital expenditures, acquisitions of other firms and investment in marketable securities. Figure 19 shows sustained investment in property, plant and equipment that is consistent with the company's expansion strategy. This means that the company invested in long-term assets from cash raised through financing activities since there was no cash generated from operating activities. 23 - 01-002-2014-2 Cash Flow from Financing Activities A glance at the cash flows from financing reveals a heavy reliance on short-term debt to finance the company's capital expenditures and operating cash flow deficits. As financial distress increased in the later years, the company issued $98.45 million and $93.9 million long-term debt in 1997 and 1999 respectively. Finally, Wilson's cash flow needs and growing debt burden raise questions about the wisdom of its dividend policy. This outflow of cash could have been used to finance the company's operating deficits, capital expenditures or to pay down debt. In summary, Wilson's use of short-term debt, coupled with its inability to generate positive cash flows from operations, posed the company as a serious credit risk which eventually forced the company to declare bankruptcy. Free Cash Flows Free cash flow is the spare (literally without defined purpose) cash beyond that needed by a company to grow at its current rate or in other words, sustain its current level of operations. It reflects the residual cash balance left to the suppliers of capital, creditors and common stock owners. Typically, these cash flows are used to pay dividends, make acquisitions, pay interest, research on new product lines etc. Moreover, it is a crucial consideration if there are plans to expand the asset base and make further investments. The excess of operating cash flow over capital expenditures is known as free cash flow. The measure is generally used for the purpose of valuing a company or its equity securities. Free cash flows may be further refined as free cash flow to the firm (FCFF) or free cash flow to equity (FCFE). FCFF is the cash flow available to the company's suppliers of debt and equity capital after all operating expenses have been paid and investments in working capital and fixed capital have been made. FCFF can be computed using the following equation: FCFF = Net Income + Non-cash Charges (such as depreciation and amortisation) + Interest (1 - Tax rate) - Capital Expenditures - Working Capital Expenditures - 24 - 01-002-2014-2 Interest is added back in the above equation because FCFF is the cash flow available to the suppliers of debt as well as equity capital. The above equation can also be rewritten as: FCFF = Cash Flow from Operating Activities + Interest (1 - Tax rate) - Capital Expenditures The computation of FCFF for ABC Company (based on the data from Figures 6 and 9, and Table 3) is as follows: Table 4 Computation of FCFF for ABC Company Cash flow from operations Plus: Interest (1 - tax rate) (Rs. 258 [1 - (Rs. 1,139/ Rs. 3,349)]} Less: Net investments in fixed capital (Rs. 1,300 - Rs. 762) FCFF Rs. 2,606 170 (538) Rs.2.238 FCFE is the cash available to the company's common stockholders after all operating expenses and borrowing costs (principal and interest) have been paid and investments in working capital and fixed capital have been made. Positive FCFE means that the company has an excess of operating cash flow over amounts needed for investments for the future and repayment of debt. FCFE can be computed using the following equation: FCFE = Cash Flow from Operating Activities - Capital Expenditures + Net Borrowing -Net Debt Repayment Table 5 Computation of FCFE for ABC Company (Based on the Data Provided) Cash flow from operations Less: Net investment in fixed capital (Rs. 1,300 - Rs.762) Less: Debt repayment FCFE Rs. 2,606 (538) (500) Rs.1,568 25 01-002-2014-2 Cash Flow Operations to Net Income is a very common ratio used to measure the quality of earnings and is calculated by comparing: Cash flow from Operations Net Income The closer this figure is to 1. the better the quality of earnings a firm has undertaken. Moreover, consistent trend distortions in Cash Flow from Operations apropos Net Income are taken as an indicator of accounting irregularities and/or malpractice. A good idea would be to compare 10 year moving averages of both the variables on a graph and see whether the trends differ. Using Honda's financial statements (Appendix 2), the Cash Flow to Net Income has changed from negative -4.53% (2012) to 17.8% (2013) which show a huge discrepancy between what is being generated from operations as cash and what is being reported as accounting net income. In such cases, detailed investigation of accounts must be made. If you look at point 31.1(Appendix 2) in the notes to the financial statements for Honda, you will see that this change is mainly due to the change in working capital The Burn Rate is a great indicator of how much cash a company needs on daily basis and is calculated by: Total Cash Expenses on Income Statement 365 The numerator includes all the expenses which are paid for in cash. Non cash expenditures such as depreciation and provision charges wouldn't make it to this list. As the name suggests, this ratio indicates the amount of hard cash a business is burning each day. Divide this ratio by the actual cash in hand and you will find the number of days your current cash balance can sustain your business activities. Typically, start-ups have a significantly high burn rate and this is exactly why they resort to external financing 27 01-002-2014-2 Table 6 Other Ratios based on Cash Flows and What They Measure Ratios Cash flow to revenue Calculation CFO - Net Revenue What it Mensures Cash generated per rupee of revenue Cash flow per share (CFO - Preferred dividends) Operating cash flow on a per share + Number of common shares basis outstanding Debt coverage CFO - Total Debt Financial risk and financial leverage Debt payment CFO - Cash Paid for Long. Ability to pay debts with operating Term Debt Repayment cash flows Dividend payment CFO - Dividends Paid Ability to pay dividends with operating cash flows Investing and financing CFO - Cash Outflows for Ability to acquire assets, pay debts, Investing and Financing and make distributions to owners Activities - 28 STATEMENT OF CASH FLOWS: PREPARATION, ANALYSIS & LINKAGES How was Lucky Cement Limited Company able to invest Rs. 5.6 billion in a long-term investment while still paying cash dividends of nearly Rs. 2 billion in the year ended 2013? How was the company able to pay back over Rs. 6.5 billion of short and long term debts in the year ended 2012? How did the cash and bank balance account for Honda Atlas Pakistan increase from Rs. 82 million in the March 31, 2012 year-end Statement of Financial Position to Rs. 3.5 billion in the year-end 2013 balance sheet? How was PIA able to invest nearly Rs. 8 billion in property, plant and equipment in 2012 while reporting a net loss of Rs. 33 billion in the same year? Such questions are often asked by those interested in the financial operations of a business enterprise e.g. investors, creditors, top management and board of directors. Balance sheets, income statements and statements of equity often fail to provide answers to these questions; therefore companies are required to prepare a fourth primary financial statement i.e. the statement of cash flows. Commonly referred to as balance sheet. This note was written by Assistant Professor Asad Alam at the Lahore University of Management Sciences to serve as basis for class discussion rather than to illustrate either effective or ineffective handling of an administrative situation. The intent of this note is not to malign or question practices of the cited companies. Questions of scrutiny are raised only for the purpose of academic interest and with scholarly intent. The data has been gathered and analysed with immense diligence and with an aim to represent as valid a picture as possible. This material may not be quoted, photocopied or reproduced in any form without the prior written consent of the Lahore University of Management Sciences. Investors usually consider net income as a key indicator of a company's financial health and future prospects. The following graph shows the net income of a company over a seven year period in millions of rupees. Figure 1 A Company's Net Income over a Seven Year Period in Millions of Rupees 50 40 30 Millions of Rupees -Income 20 10 0 1 2 3 4 5 6 7 Year Between years 1 to 4, net income for this company grew from Rs. 31 million to Rs. 41 million i.e. by 32%. The company had consistently paid dividends and interest. As an investor, Does this company look like a good investment? Would you expect its profitability to continue since the net income between years 6 and 7 is on an upward trend? If you answer 'yes' to both the questions by buying the company's stock, you would be in for a rude shock as the company filed for bankruptcy eighteen months later. Detailed examination of the company's financial statements revealed that the company had experienced several years of negative cash flow from its operations, even though it reported profits. How could this happen? It was partly because the sales that the company reported 2 - were made on credit and the company was having trouble collecting the receivables from the sales, causing cash flow to be less than the net income. In the wake of recent high-profile scandals, the landscape is beginning to change. The majority of investors are now aware of the concept of quality of earnings. Investors do understand that corporate management can, in various ways, manipulate earnings as reflected in the income statement. As a result, certain investors shun reported earnings and instead focus more attention on other metrics to evaluate the operational health of a business. One of the metrics that many analysts embrace is the cash flow measurement, since cash is more difficult to manipulate than earnings. The statement of cash flows provides information not available from other financial statements. For example, it helps indicate how it is possible for a company to report a net loss and still make large capital expenditures or pay cash dividends. Information about cash inflows and outflows is important because dividends and debt payments are made with cash, not profit. Investors and creditors may be interested in the firm's sources of cash e.g. if they would be recurring or they are one-time events, like the sale of assets. Cash flow measures are more reliable because, unlike profit measures, they are not vulnerable to accounting. For example, accrual accounting has two principal components: The Revenue Recognition Principle, which states that revenue is recorded when it is eamed The Matching Principle, which states that expenses recognised when "incurred' Neither the recognition of revenue nor that of expense necessarily involves the receipt or payment of cash. Accrual basis earnings therefore do not convey much information about cash inflow to and outflows from the entity. Therefore cash becomes the ultimate measure by which a company is judged. According to Sohail Hassan Khan, VP of ICI Paints Pakistan, "Profit is a concept, cash flow is reality." He added that "the study of cash flow often paints a very different picture than profits; cash flow is the real barometer for business, as profit numbers can be more easily manipulated." Analysing the cash flow statement is integral to understanding a company's financial performance and position because it often provides a check for the quality of the earnings shown in the income statement. Cash flows are also critical for assessing a company's liquidity and creditworthiness. The primary purpose of the statement of cash flows is to - 3 - 01-002-2014-2 5/34 3. Changes in cash can also be caused by financing activities like the issuance of stock or bonds, repayment of bank loan or paying dividends to stockholders. The statement of cash flows summarises cash inflows and outflows of a company broken down into three principal activities as shown in Figure 3 below. Figure 3 Format of Statement of Cash Flows 570,000 (319,000) (218,000) (8,000) (5,000) Cash from Operating PKR 20,000 ABC Company Statement of Cash Flows For Year Ended December 31, 2013 Cash flows from operating activities Cash received from customs PKR Cash paid for merchandise Cash paid for wages and other operating expenses Cash paid for interest Cash paid for taxes Net cash provided by operating activities Cash flows from investing activities Cash received from sale of plant assets Cash paid for purchase of plant assets Net cash provided by investing activities Cash flows from financing activities Cash received from issuing stock Cash paid to retire notes Cash paid for dividends Net cash used in financing activities Net increase in cash Cash balance at prior year-end Cash balance at current year-end 12,000 (10,000) Cash from Investing 2,000 15,000 (18,000) (14,000) (17,000) PKR 5,000 12,000 PKR 17,000 Cash from Financing Cash Provided Details of these activities will be covered in the next section, but the general rule of thumb is that companies that are able to satisfy most of their cash needs from operating activities are generally considered to be in stronger financial health and better credit risks. .5. CLASSIFICATION OF CASH FLOWS Statement of Cash Flows is covered under International Accounting Standard 7 (IAS 7). which requires an entity to present a statement of cash flows as an integral part of its primary financial statements, along with Balance Sheet, Income Statement and Statement of Changes in Shareholders' Equity, IAS 7 defines cash equivalents as "short-term, highly liquid investments that are readily convertible to known amounts of cash and which are subject to an insignificant risk of changes in value." Script from IAS 7 covering the definition of Cash and Cash equivalents is stated in Appendix 1. According to IAS 7. "The statement of cash flows analyses changes in cash and cash equivalents during a period, Cash and cash equivalents comprise cash on hand and demand deposits, together with short-term, highly liquid investments that are readily convertible to a known amount of cash and that are subject to an insignificant risk of changes in value. An investment normally meets the definition of a cash equivalent when it has a maturity of three months or less from the date of acquisition 2 The statement of cash flows classifies cash receipts and cash payments by operating, investing and financing activities. Operating activities are revenue producing activities, for example, cash receipts from customers for sale of goods and rendering of services, or cash payments to suppliers for goods and services and employees. These are the core activities of a business contextualised by what is the operative scope of the business and determine the profit or loss of an entity, For example, in a company like Unilever, cash flows related to sale of Surf Excel detergent and Clear shampoo will be classified as operating cash flows but the loss on sale of its Walls ice-cream division will not be considered as operating cash flows. Investing activities are the acquisition and disposal of long-term assets and investments c.g, cash payments to acquire fixed assets. These activities need to be analysed as they represent future income and cash flows potential International Accounting Standard 7 Financing activities result in changes in the size and composition of the equity capital and borrowings of the entity, for example, cash proceeds from issue of shares, debentures, loans, notes, bonds, mortgages and other short or long-term borrowings. REPORTING CASH FLOWS FROM OPERATING ACTIVITIES An entity can report cash flows from operating activities using either: Direct method Indirect method Indirect Method The indirect method, also called the balance sheet method, shows how cash flow from operations can be calculated from reported net income as the result of a series of adjustments made for items that affected net income but did not affect cash. The indirect method begins with net income. To reconcile net income with operating cash flow, the following adjustments are made to the net income Items are included in net income that did not affect cash in the current period such as: o Noncash revenues or gains (e.g. accounts receivable and gains on disposal of fixed assets); Noncash expenses or losses (e.g. depreciation and amortisation, provision for bad debt expense and expenses recorded in income statement but not paid in cash). Items are excluded from net income that did affect operating cash flows in the current period, such as: o Cash inflows (revenues) received but not recognised as earned in the current period (e.g. prepaid rent and collections on accounts receivable): o Cash outflows (expenses) paid but not recognised for accrual purposes in the current period (e.g. prepaid insurance and payments on accounts payable). 01-002-2014-2 The figure below illustrates the adjustments made to accrual basis net income: Figure 4 Adjustments made to Accrual Basis Net Income Earned Eliminate Revenues Non-cash revenues Net Income Operating cash flow Expenses Eliminate Incurred Non-cash charges Note that cash flow from investing activities and from financing activities is identical under either method. Direct Method The direct method of preparing cash flow shows each major class of gross cash receipts and gross cash payments. The operating cash flows section of the statement of cash flows under the direct method would appear something like Table 1: Table 1 Format of Statement of Cash Flows under Direct Method Cash receipts from customers XX.XXX Cash paid to suppliers XX.XXX Cash paid to employees XX.XXX Cash paid for other operating expenses XX.XXX Interest paid XX.XXX Income taxes paid XX.XXX Net cash from operating activities XX.XXX 8- 01-002-2014-2 In this format, the cash received from customers, as well as other operating items, is clearly shown. One can contrast the change in revenues from the income statement with the change in cash received from customers. For example, an increase in revenues coupled with a decrease in cash received from customers could signal collection problems. Cash flow from investing activities and from financing activities is identic 9/34 direct and indirect methods. According to IAS 7. cash flows from interest paid and interest and dividends received are usually classified as operating cash flows for a financial institution. However interest paid and interest and dividends received for all other entities may be classified as financing cash flows and investing cash flows respectively, because they are the costs of obtaining financial resources or returns on invStep by Step Solution
There are 3 Steps involved in it
Step: 1

Get Instant Access to Expert-Tailored Solutions
See step-by-step solutions with expert insights and AI powered tools for academic success
Step: 2

Step: 3
Ace Your Homework with AI
Get the answers you need in no time with our AI-driven, step-by-step assistance
Get Started
Simple Cryptocurrency Dive Into The Life Of Cryptocurrency
Authors: Dwayne Wanek
1st Edition
979-8353620914