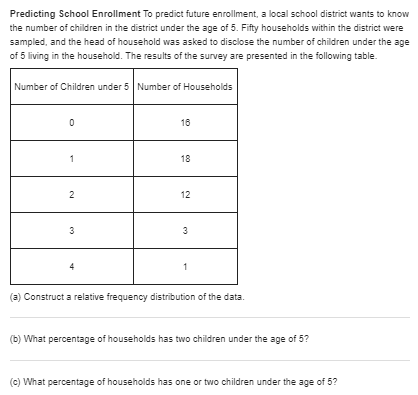
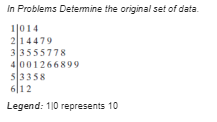
need details:-
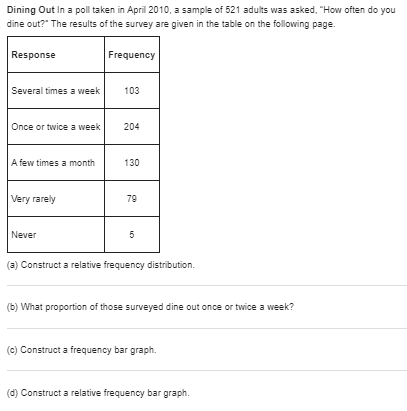
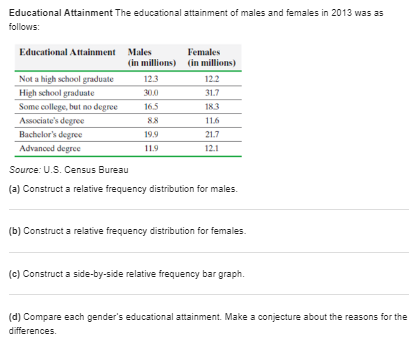
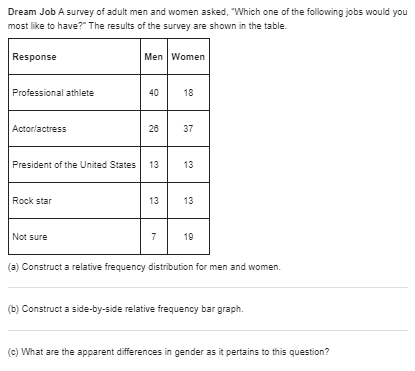
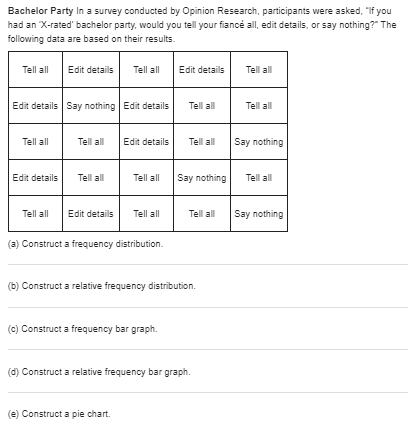
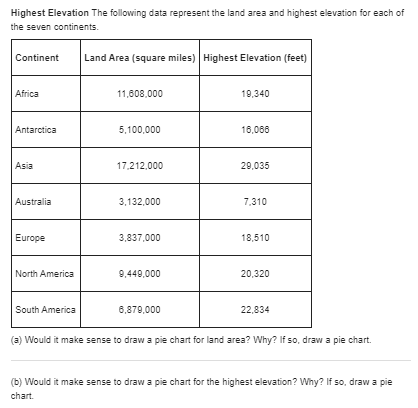
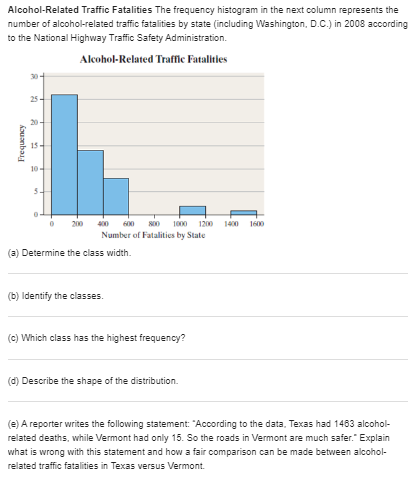
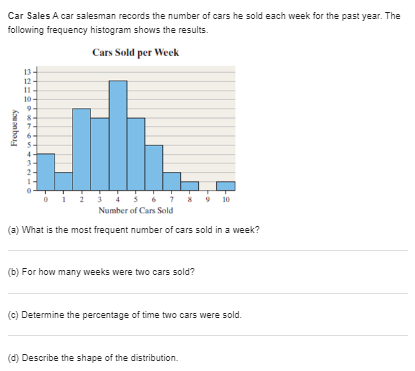
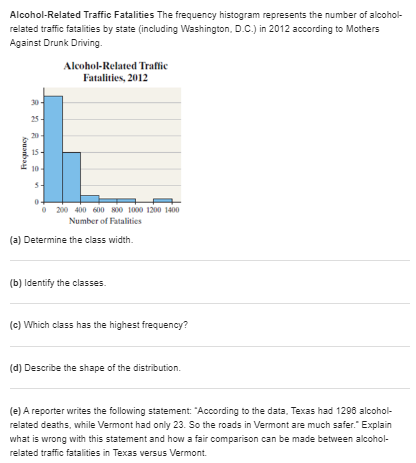
Dining Out In a poll taken in April 2010, a sample of 521 adults was asked, "How often do you dine out?" The results of the survey are given in the table on the following page Response Frequency Several times a week 103 Once or twice a week 204 A few times a month 130 Very rarely 79 Never 5 (3) Construct a relative frequency distribution. (b) What proportion of those surveyed dine out once or twice a week? (c) Construct a frequency bar graph. (d) Construct a relative frequency bar graph.Educational Attainment The educational attainment of males and females in 2013 was as follows: Educational Attainment Males Females (in millions) (in millions) Not a high school graduate 123 122 High school graduate 30n 31.7 Some college, but no degree 165 183 Associate's degree 116 Bachelor's degree 19.9 21.7 Advanced degree 11.9 121 Source: U.S. Census Bureau (a) Construct a relative frequency distribution for males. (b) Construct a relative frequency distribution for females. (c) Construct a side-by-side relative frequency bar graph. (d) Compare each gender's educational attainment. Make a conjecture about the reasons for the differences.Dream Job A survey of adult men and women asked, "Which one of the following jobs would you most like to have?" The results of the survey are shown in the table. Response Men | Women Professional athlete 40 18 Actor/actress 26 37 President of the United States 13 13 Rock star 13 13 Not sure 7 19 (3) Construct a relative frequency distribution for men and women. (b) Construct a side-by-side relative frequency bar graph. (c) What are the apparent differences in gender as it pertains to this question?Bachelor Party In a survey conducted by Opinion Research, participants were asked, "If you had an "X-rated" bachelor party, would you tell your fiance all, edit details, or say nothing?" The following data are based on their results. Tell all Edit details Tell all Edit details Tell all Edit details | Say nothing | Edit details Tell all Tell all Tell all Tell all Edit details Tell all Say nothing Edit details Tell all Tell all Say nothing Tell all Tell all Edit details Tell all Tell all Say nothing (3) Construct a frequency distribution. (b) Construct a relative frequency distribution. (c) Construct a frequency bar graph. (d) Construct a relative frequency bar graph. (e) Construct a pie chart.Highest Elevation The following data represent the land area and highest elevation for each of the seven continents. Continent Land Area (square miles) | Highest Elevation (feet) Africa 11,608.000 19,340 Antarctica 5,100,000 16,056 Asia 17.212.000 20,035 Australia 3,132,000 7,310 Europe 3,837,000 18,510 North America 9,440,000 20,320 South America 8,879,000 22,834 (3) Would it make sense to draw a pie chart for land area? Why? If so, draw a pie chart. (b) Would it make sense to draw a pie chart for the highest elevation? Why? If so, draw a pie chart.\f\f\fCar Sales A car salesman records the number of cars he sold each week for the past year. The following frequency histogram shows the results. Cars Sold per Week 13 - 12 - 10 - Frequency 7 10 Number of Cars Sold (3) What is the most frequent number of cars sold in a week? (b) For how many weeks were two cars sold? (c) Determine the percentage of time two cars were sold. (d) Describe the shape of the distribution.Alcohol-Related Traffic Fatalities The frequency histogram represents the number of alcohol- related traffic fatalities by state (including Washington, D.C.) in 2012 according to Mothers Against Drunk Driving. Alcohol-Related Traffic Fatalities, 2012 30 Frequency 200 400 600 830 1000 1200 1400 Number of Fatalities (a) Determine the class width. (b) Identify the classes. (c) Which class has the highest frequency? (d) Describe the shape of the distribution. (e) A reporter writes the following statement: "According to the data, Texas had 1296 alcohol- related deaths, while Vermont had only 23. So the roads in Vermont are much safer." Explain what is wrong with this statement and how a fair comparison can be made between alcohol- related traffic fatalities in Texas versus Vermont.\f\f\f\f