Need help answering 5.23. Included questions 5.13 and 5.12 as they relate (don't think you actually need to solve those Qs though)

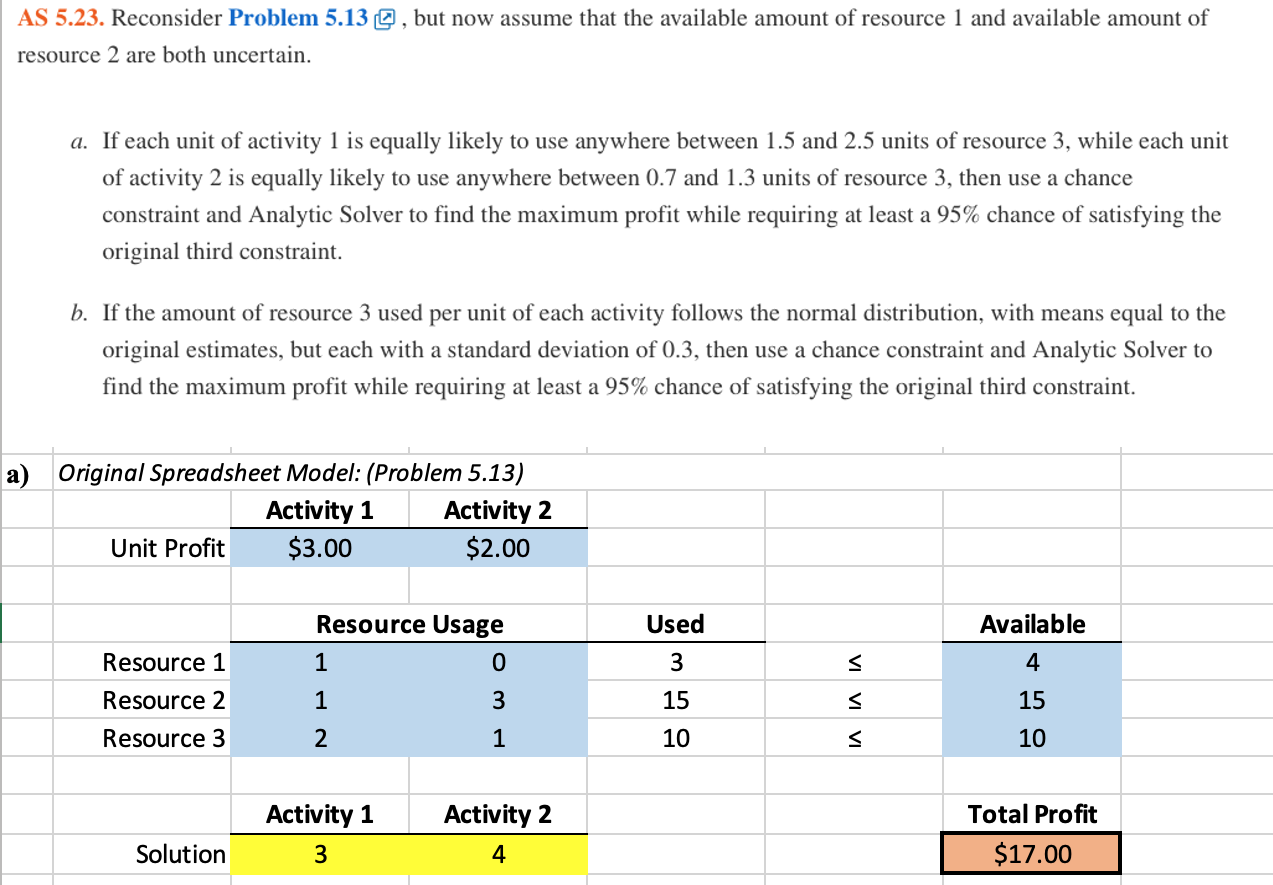
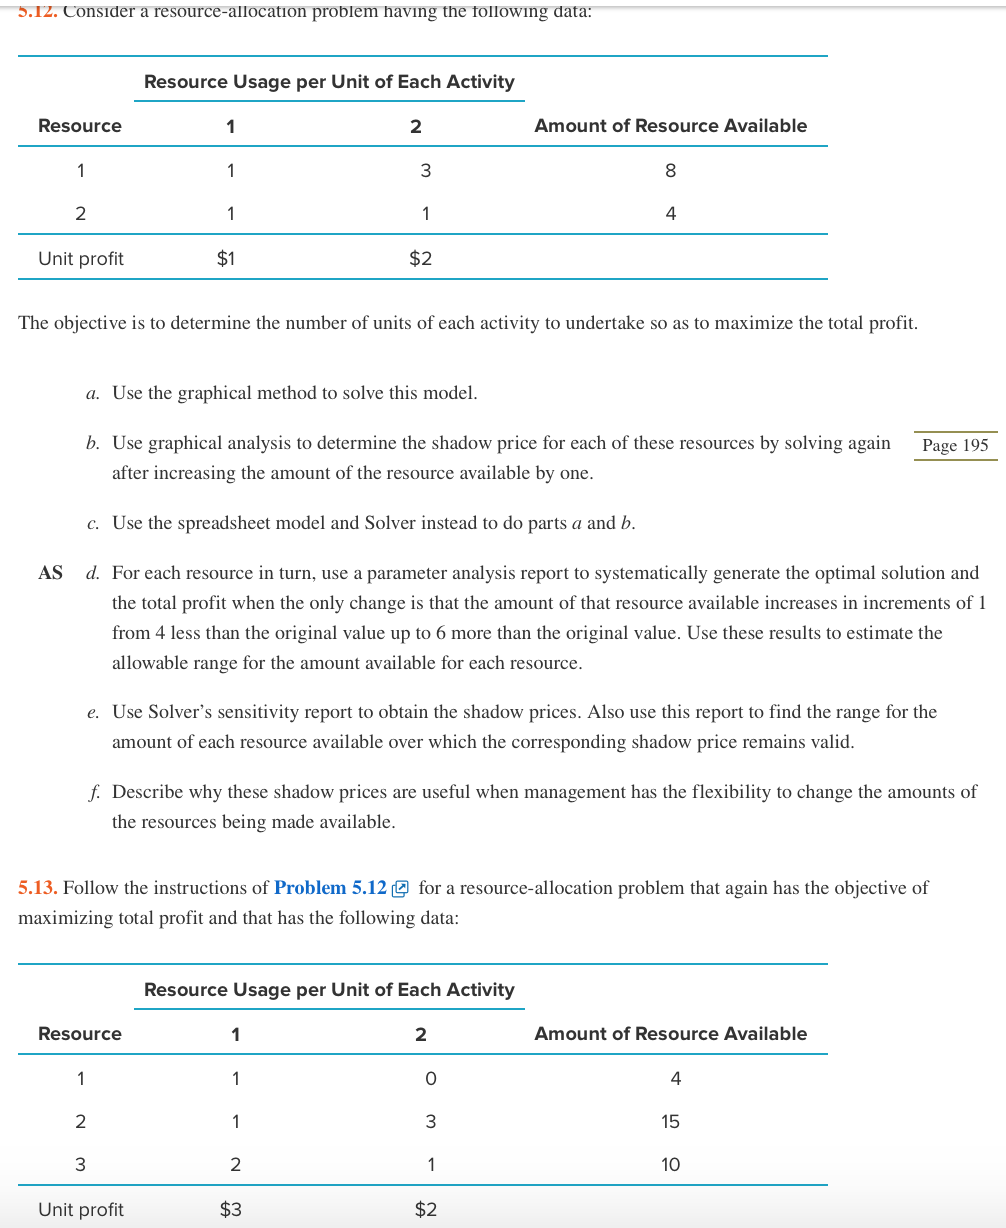
AS 5.23. Reconsider Problem 5.13 @ , but now assume that the available amount of resource 1 and available amount of resource 2 are both uncertain. a. If each unit of activity 1 is equally likely to use anywhere between 1.5 and 2.5 units of resource 3, while each unit of activity 2 is equally likely to use anywhere between 0.7 and 1.3 units of resource 3, then use a chance constraint and Analytic Solver to find the maximum profit while requiring at least a 95% chance of satisfying the original third constraint. b. If the amount of resource 3 used per unit of each activity follows the normal distribution, with means equal to the original estimates, but each with a standard deviation of 0.3, then use a chance constraint and Analytic Solver to find the maximum profit while requiring at least a 95% chance of satisfying the original third constraint. a) Original Spreadsheet Model: (Problem 5.13) Activity 1 Activity 2 Unit Profit $3.00 $2.00 Used Available Resource Usage 1 0 3 4 Resource 1 Resource 2 Resource 3 1 3 15 VI VI VI 15 2 1 10 10 Activity 1 3 Activity 2 4 Total Profit $17.00 Solution 5.12. Consider a resource-allocation problem having the following data: Resource Usage per Unit of Each Activity Resource 1 2 Amount of Resource Available 1 1 3 8 2 1 1 4 Unit profit $1 $2 The objective is to determine the number of units of each activity to undertake so as to maximize the total profit. a. Use the graphical method to solve this model. Page 195 b. Use graphical analysis to determine the shadow price for each of these resources by solving again after increasing the amount of the resource available by one. c. Use the spreadsheet model and Solver instead to do parts a and b. AS d. For each resource in turn, use a parameter analysis report to systematically generate the optimal solution and the total profit when the only change is that the amount of that resource available increases in increments of 1 from 4 less than the original value up to 6 more than the original value. Use these results to estimate the allowable range for the amount available for each resource. e. Use Solver's sensitivity report to obtain the shadow prices. Also use this report to find the range for the amount of each resource available over which the corresponding shadow price remains valid. f. Describe why these shadow prices are useful when management has the flexibility to change the amounts of the resources being made available. 5.13. Follow the instructions of Problem 5.12 Q for a resource-allocation problem that again has the objective of maximizing total profit and that has the following data: Resource Usage per Unit of Each Activity Resource 1 2 Amount of Resource Available 1 1 0 4 2 1 3 15 3 2 1 10 Unit profit $3 $2 AS 5.23. Reconsider Problem 5.13 @ , but now assume that the available amount of resource 1 and available amount of resource 2 are both uncertain. a. If each unit of activity 1 is equally likely to use anywhere between 1.5 and 2.5 units of resource 3, while each unit of activity 2 is equally likely to use anywhere between 0.7 and 1.3 units of resource 3, then use a chance constraint and Analytic Solver to find the maximum profit while requiring at least a 95% chance of satisfying the original third constraint. b. If the amount of resource 3 used per unit of each activity follows the normal distribution, with means equal to the original estimates, but each with a standard deviation of 0.3, then use a chance constraint and Analytic Solver to find the maximum profit while requiring at least a 95% chance of satisfying the original third constraint. a) Original Spreadsheet Model: (Problem 5.13) Activity 1 Activity 2 Unit Profit $3.00 $2.00 Used Available Resource Usage 1 0 3 4 Resource 1 Resource 2 Resource 3 1 3 15 VI VI VI 15 2 1 10 10 Activity 1 3 Activity 2 4 Total Profit $17.00 Solution 5.12. Consider a resource-allocation problem having the following data: Resource Usage per Unit of Each Activity Resource 1 2 Amount of Resource Available 1 1 3 8 2 1 1 4 Unit profit $1 $2 The objective is to determine the number of units of each activity to undertake so as to maximize the total profit. a. Use the graphical method to solve this model. Page 195 b. Use graphical analysis to determine the shadow price for each of these resources by solving again after increasing the amount of the resource available by one. c. Use the spreadsheet model and Solver instead to do parts a and b. AS d. For each resource in turn, use a parameter analysis report to systematically generate the optimal solution and the total profit when the only change is that the amount of that resource available increases in increments of 1 from 4 less than the original value up to 6 more than the original value. Use these results to estimate the allowable range for the amount available for each resource. e. Use Solver's sensitivity report to obtain the shadow prices. Also use this report to find the range for the amount of each resource available over which the corresponding shadow price remains valid. f. Describe why these shadow prices are useful when management has the flexibility to change the amounts of the resources being made available. 5.13. Follow the instructions of Problem 5.12 Q for a resource-allocation problem that again has the objective of maximizing total profit and that has the following data: Resource Usage per Unit of Each Activity Resource 1 2 Amount of Resource Available 1 1 0 4 2 1 3 15 3 2 1 10 Unit profit $3 $2


