

Answered step by step
Verified Expert Solution
Question
1 Approved Answer
Need help ASAP A slug test analysis was performed on a piezometer in Wellington NSW. Fig. 4 (see next page) shows the water level response
Need help ASAP
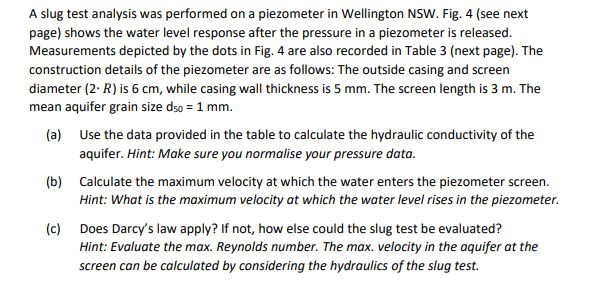
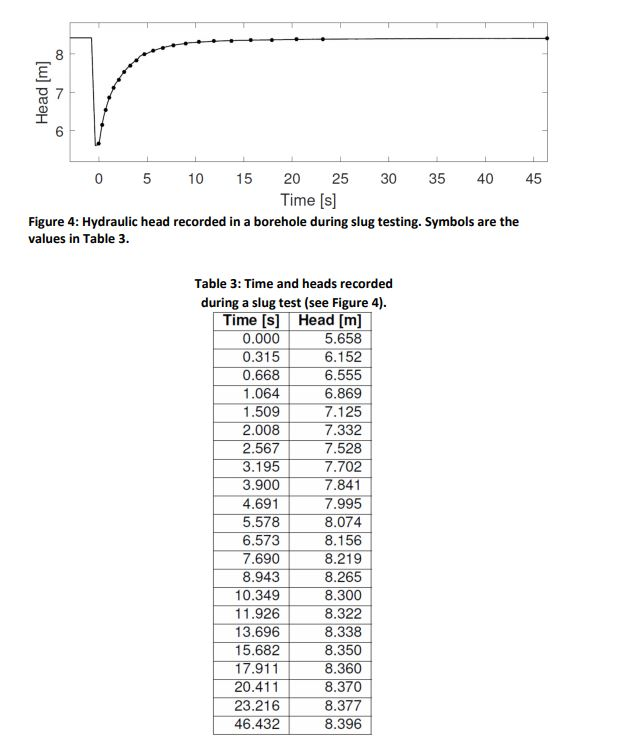
A slug test analysis was performed on a piezometer in Wellington NSW. Fig. 4 (see next page) shows the water level response after the pressure in a piezometer is released. Measurements depicted by the dots in Fig. 4 are also recorded in Table 3 (next page). The construction details of the piezometer are as follows: The outside casing and screen diameter (2. R) is 6 cm, while casing wall thickness is 5 mm. The screen length is 3 m. The mean aquifer grain size dso = 1 mm. (a) Use the data provided in the table to calculate the hydraulic conductivity of the aquifer. Hint: Make sure you normalise your pressure data. (b) Calculate the maximum velocity at which the water enters the piezometer screen. Hint: What is the maximum velocity at which the water level rises in the piezometer. (c) Does Darcy's law apply? If not, how else could the slug test be evaluated? Hint: Evaluate the max. Reynolds number. The max. velocity in the aquifer at the screen can be calculated by considering the hydraulics of the slug test. 00 Head [m] 7 6 45 0 5 10 15 20 25 30 35 40 Time [s] Figure 4: Hydraulic head recorded in a borehole during slug testing. Symbols are the values in Table 3. Table 3: Time and heads recorded during a slug test (see Figure 4). Time [s] Head [m] 0.000 5.658 0.315 6.152 0.668 6.555 1.064 6.869 1.509 7.125 2.008 7.332 2.567 7.528 3.195 7.702 3.900 7.841 4.691 7.995 5.578 8.074 6.573 8.156 7.690 8.219 8.943 8.265 10.349 8.300 11.926 8.322 13.696 8.338 15.682 8.350 17.911 8.360 20.411 8.370 23.216 8.377 46.432 8.396 A slug test analysis was performed on a piezometer in Wellington NSW. Fig. 4 (see next page) shows the water level response after the pressure in a piezometer is released. Measurements depicted by the dots in Fig. 4 are also recorded in Table 3 (next page). The construction details of the piezometer are as follows: The outside casing and screen diameter (2. R) is 6 cm, while casing wall thickness is 5 mm. The screen length is 3 m. The mean aquifer grain size dso = 1 mm. (a) Use the data provided in the table to calculate the hydraulic conductivity of the aquifer. Hint: Make sure you normalise your pressure data. (b) Calculate the maximum velocity at which the water enters the piezometer screen. Hint: What is the maximum velocity at which the water level rises in the piezometer. (c) Does Darcy's law apply? If not, how else could the slug test be evaluated? Hint: Evaluate the max. Reynolds number. The max. velocity in the aquifer at the screen can be calculated by considering the hydraulics of the slug test. 00 Head [m] 7 6 45 0 5 10 15 20 25 30 35 40 Time [s] Figure 4: Hydraulic head recorded in a borehole during slug testing. Symbols are the values in Table 3. Table 3: Time and heads recorded during a slug test (see Figure 4). Time [s] Head [m] 0.000 5.658 0.315 6.152 0.668 6.555 1.064 6.869 1.509 7.125 2.008 7.332 2.567 7.528 3.195 7.702 3.900 7.841 4.691 7.995 5.578 8.074 6.573 8.156 7.690 8.219 8.943 8.265 10.349 8.300 11.926 8.322 13.696 8.338 15.682 8.350 17.911 8.360 20.411 8.370 23.216 8.377 46.432 8.396Step by Step Solution
There are 3 Steps involved in it
Step: 1

Get Instant Access to Expert-Tailored Solutions
See step-by-step solutions with expert insights and AI powered tools for academic success
Step: 2

Step: 3
Ace Your Homework with AI
Get the answers you need in no time with our AI-driven, step-by-step assistance
Get Started
Accounting Audits In The Democratic Republic Of Congo
Authors: Charles Kyungu Kakudji
1st Edition
6206327043, 978-6206327042