need help
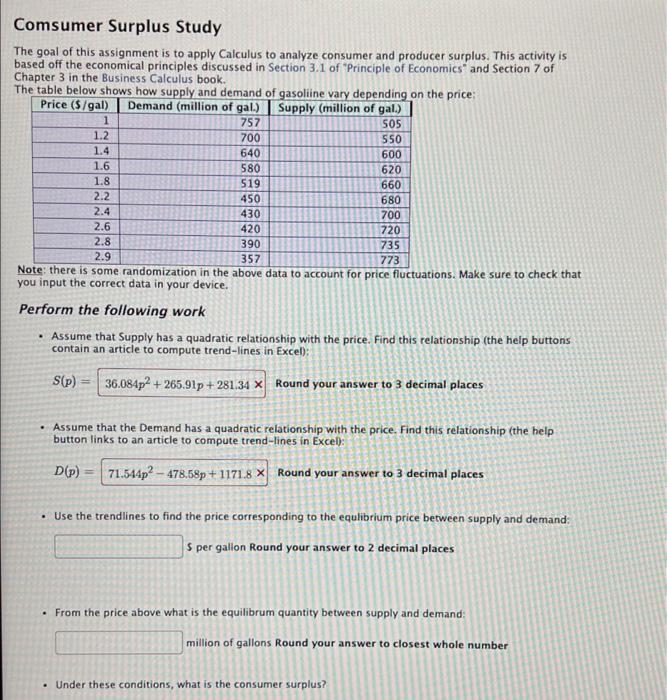
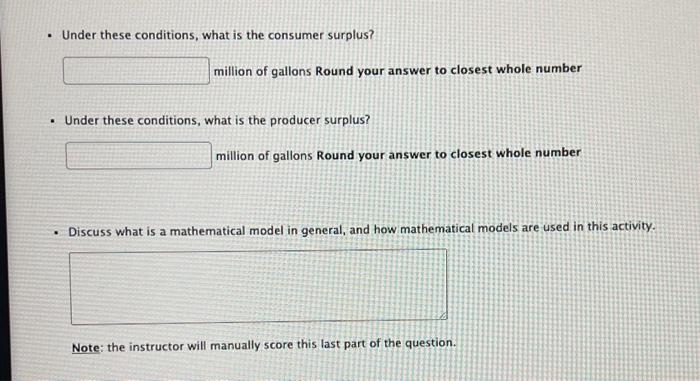
Comsumer Surplus Study The goal of this assignment is to apply Calculus to analyze consumer and producer surplus. This activity is based off the economical principles discussed in Section 3.1 of Principle of Economics and Section 7 of Chapter 3 in the Business Calculus book. The table below shows how supply and demand of gasoliine vary depending on the price: Price (s/gal) Demand (million of gal.) Supply (million of gal.) 1 757 505 1.2 700 550 1.4 640 600 1.6 580 620 1.8 519 660 2.2 450 680 2.4 430 700 2.6 420 720 2.8 390 735 2.9 773 Note: there is some randomization in the above data to account for price fluctuations. Make sure to check that you input the correct data in your device. Perform the following work Assume that Supply has a quadratic relationship with the price. Find this relationship (the help buttons contain an article to compute trend-lines in Excel): 357 S(p) 36.084p2 + 265.91p+ 281.34 Round your answer to 3 decimal places Assume that the Demand has a quadratic relationship with the price. Find this relationship (the help button links to an article to compute trend-lines in Excel): D() 71.544p2 - 478,58p + 1171.8 X Round your answer to 3 decimal places Use the trendlines to find the price corresponding to the equlibrium price between supply and demand. S per gallon Round your answer to 2 decimal places From the price above what is the equilibrum quantity between supply and demand million of gallons Round your answer to closest whole number Under these conditions, what is the consumer surplus? Under these conditions, what is the consumer surplus? million of gallons Round your answer to closest whole number Under these conditions, what is the producer surplus? million of gallons Round your answer to closest whole number Discuss what a mathematical model in general, and how mathematical models are used in this activity. Note: the instructor will manually score this last part of the question. Comsumer Surplus Study The goal of this assignment is to apply Calculus to analyze consumer and producer surplus. This activity is based off the economical principles discussed in Section 3.1 of Principle of Economics and Section 7 of Chapter 3 in the Business Calculus book. The table below shows how supply and demand of gasoliine vary depending on the price: Price (s/gal) Demand (million of gal.) Supply (million of gal.) 1 757 505 1.2 700 550 1.4 640 600 1.6 580 620 1.8 519 660 2.2 450 680 2.4 430 700 2.6 420 720 2.8 390 735 2.9 773 Note: there is some randomization in the above data to account for price fluctuations. Make sure to check that you input the correct data in your device. Perform the following work Assume that Supply has a quadratic relationship with the price. Find this relationship (the help buttons contain an article to compute trend-lines in Excel): 357 S(p) 36.084p2 + 265.91p+ 281.34 Round your answer to 3 decimal places Assume that the Demand has a quadratic relationship with the price. Find this relationship (the help button links to an article to compute trend-lines in Excel): D() 71.544p2 - 478,58p + 1171.8 X Round your answer to 3 decimal places Use the trendlines to find the price corresponding to the equlibrium price between supply and demand. S per gallon Round your answer to 2 decimal places From the price above what is the equilibrum quantity between supply and demand million of gallons Round your answer to closest whole number Under these conditions, what is the consumer surplus? Under these conditions, what is the consumer surplus? million of gallons Round your answer to closest whole number Under these conditions, what is the producer surplus? million of gallons Round your answer to closest whole number Discuss what a mathematical model in general, and how mathematical models are used in this activity. Note: the instructor will manually score this last part of the