Answered step by step
Verified Expert Solution
Question
1 Approved Answer
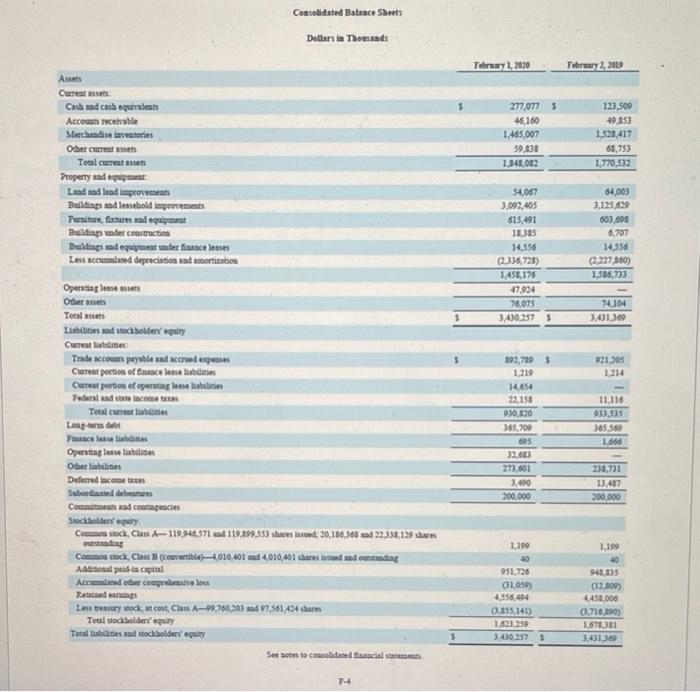
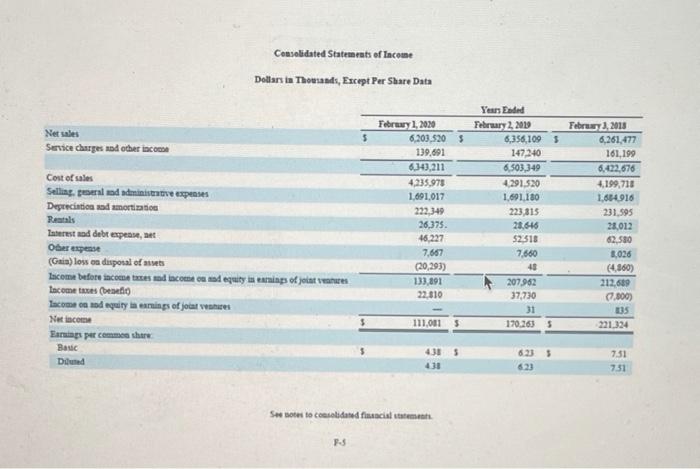
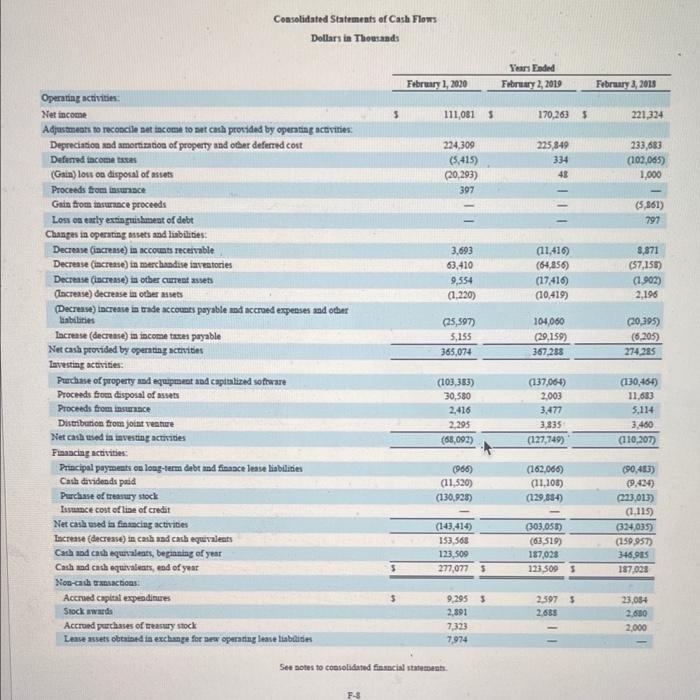
need help Consolidated Balance Sheets Dollars in Thousands Foros 1.2020 February 2013 277,0775 46.160 1.465,007 59.835 1,848,012 123,509 49,350 1.520.417 68,753 1,770,532 Ames Cureat as
need help 


Consolidated Balance Sheets Dollars in Thousands Foros 1.2020 February 2013 277,0775 46.160 1.465,007 59.835 1,848,012 123,509 49,350 1.520.417 68,753 1,770,532 Ames Cureat as Cash ad cash equivalent Accemts receivable Merchandise inwestones Othere Toul curent en Property and equipment Laadad and improve Building and lessehold improvements Purniture, fixtures and equipment Buildings Ser construction Buildings and equipment under finance lease Les accumlated depreciation and Amortization 54,067 3.092.405 615,491 100 14.556 336,721) 1,458,176 47.924 76,075 3,410,257 5 64,003 3.125.629 603,695 6,707 14,556 2.227.860) 1536.733 74,104 3.401.69 $ 031,205 1.214 Operating lease avete OS Totalt Listies nodwockholdery equity Current liabide Trade secours payable and accrud expenses Current portion office se bates Current portion of operating lase hicies Federal and state lacomat Total curricanes Loop-handelt Pinasce lane liables Opening less liable Olabilities Deferred Subordine debe Comand courtes Stockholm equiry Common stock, Class A-119.846,371 29 119.899,553 shes base: 20,116,383 and 22.339,139 using Commen stock, Chan 3 (comutable) 4,010,401 and 4,010,401 shares med and outding Astiat paid-la capital Accountata co lens Rattadens Lex tansary stock at cost. Clau 29,760,203 and 7,361,494 sias Tool stockholders' equiry Total tibes and stockholders' equiry Ser botes to considered facial state 192,789 1.219 14,654 22.153 230,00 365,200 693 32,603 273,601 3.400 200,000 11.116 933.535 365,560 1.606 238,731 13,487 200.000 1,199 10 931.736 01.050) 4,556,494 155,141) 1.633.250 3,410,257 1.190 10 943.335 (12.109) 4458.000 0.716.490) 1.678331 3,431 369 5 3 FH Consolidated Statements of Income Dollars in Thousands, Except Per Share Data Net sales $ Service charges and other income Cost of sales Selling eeld administrative expenses Depreciation and amortization Rentals Tatod debt expert Oher expense (Gaia) lows on disposal of sen Lacome before income and income und equity in earnings of joint venues Income taxes (benefit Income cand equity in amnings of joint ventes NHI can Earnings per commentare Basic Duted February 1, 2020 6,203.520 139.691 6.149,211 4,235,978 1.691.017 222,349 26.375 46,227 7.667 (20,293) 133,891 22.010 Years Ended February 2, 2015 6,356,1095 147.240 6,503,349 4.291.520 1.691.180 223,315 28.646 52.518 7,660 48 207.962 37,730 31 170,263 $ Februsy, 2018 6,261,477 161,199 6.422,676 4,199,710 1.684,916 231.595 28,012 62,580 3,026 (4.860) 212.689 (7.000) 335 221.324 111,001 4385 30 6.335 623 7:51 731 Se notes to comedored financial statement PS Consolidated Statements of Cash Flows Dollars in Thousands February 1, 2020 Years Ended February 2, 2019 February 3, 2018 5 111,081 5 170,2635 221,324 224,309 (5,415) (20,293) 397 225 849 334 48 233,683 (103,065) 1.000 (5,861) 797 3,693 63,410 9,554 (1.220) (11,416) (64,856) (17.416) (10,419) 8,871 (37,158) (1902) 2,196 (25,597 5,155 365,074 104,060 (29.159) 367,238 (20.395) (6,205) 274.285 Operating activities Net income Adjustments to reconcile net income to net cash provided by operating activities: Depreciation and amortization of property and other deferred cost Defned income taxes (Gain) lost on disposal of assess Proceeds from insurance Gain from insurance proceeds Los os ently extinguishment of debt Changes in operating assets and liabilities: Decrease (incrense) in accomts receivable Decrease (increase) in merchandise inventories Decrease (increase) in other current assets Increase) decrease in other musets Decrease increase in tade accounts payable and accrued expenses and other liabilities Increase (decrease in income taxes payable Net cash provided by operating activities Lavesting acavities: Purchase of property and equipment and capitalized software Proceeds from disposal of assets Proceeds from insurance Distribution from joint venture Net cash used in investing activities Financing activities Principal payments on long-term debt and finance lease lisibilities Cash dividends paid Purchase of trwy stock Issunce cost of line of credit Net cash used in financing activities Tacrente decrease) in cash and cash equivalents Cash and cash equivalents, beginning of year Cash and cath equivalents, end of year Non-cash transactions Accred capital expendinues Shock wwards Accrued purchases of measury stock Lesse assets obtained in exchange for new operating lease liabilities (103,383) 30,580 2,416 2.295 (68,092) (137,064) 2,003 3.477 3,335 (127,749) (130,464) 11,683 5.114 3.460 (110,207) (966) (11,520) (130,928) (162,066) (11.103) (129,354) 190,403) 19,424) 223,013) (1.115) 324035) (159 957) 346.905 187,028 (143,414) 153,565 123,509 277,077 (303,058) (63.519) 187,028 123,500 5 2.597 5 2.655 9,2955 2.891 7323 7,974 23,054 2.630 2.000 See Botes to consolidated financial statement F-8 ) to answer the questions in the following sections. Unless otherwise stated, provide answers for the most recent fiscal year. You will also need the following information: Assume the allowance for doubtful accounts was $1,349 and $1,761 on February 1, 2020 and February 1, 2019, respectively. In addition, assume for the most recent fiscal year, write-offs were $2,500 and receivables collected were $425,368. e. What is impacted when accounts receivable are written-off? (2 points) Cash provided by operating activities Net accounts receivable None of these Net income 


Step by Step Solution
There are 3 Steps involved in it
Step: 1

Get Instant Access to Expert-Tailored Solutions
See step-by-step solutions with expert insights and AI powered tools for academic success
Step: 2

Step: 3

Ace Your Homework with AI
Get the answers you need in no time with our AI-driven, step-by-step assistance
Get Started


