

Question
Need help creating this graph in R. Please show all code so I can look up the definition and terminologies to the conditions you are
Need help creating this graph in R. Please show all code so I can look up the definition and terminologies to the conditions you are using.
mtcars dataframe.
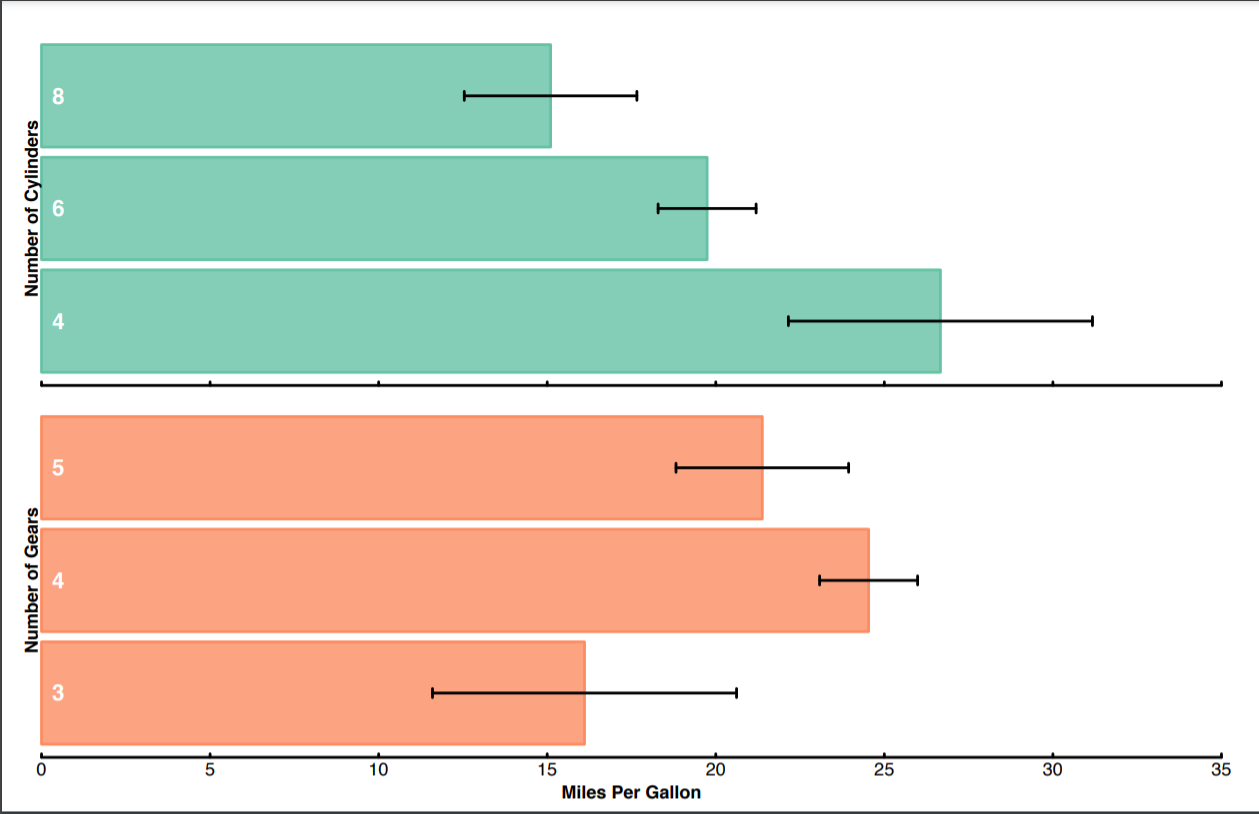
# Recreate the bar graph on blackboard created from the mtcars data frame. You # will need to calculate the mean MPG values for cars with different numbers of # cylinders and gears. You will also create error bars that represent +/- 1 # standard from the mean.
Step by Step Solution
There are 3 Steps involved in it
Step: 1

Get Instant Access to Expert-Tailored Solutions
See step-by-step solutions with expert insights and AI powered tools for academic success
Step: 2

Step: 3
Ace Your Homework with AI
Get the answers you need in no time with our AI-driven, step-by-step assistance
Get Started
SQL Server T-SQL Recipes
Authors: David Dye, Jason Brimhall
4th Edition
1484200616, 9781484200612