Need Help extending this code to fit the requiemtns of part C.
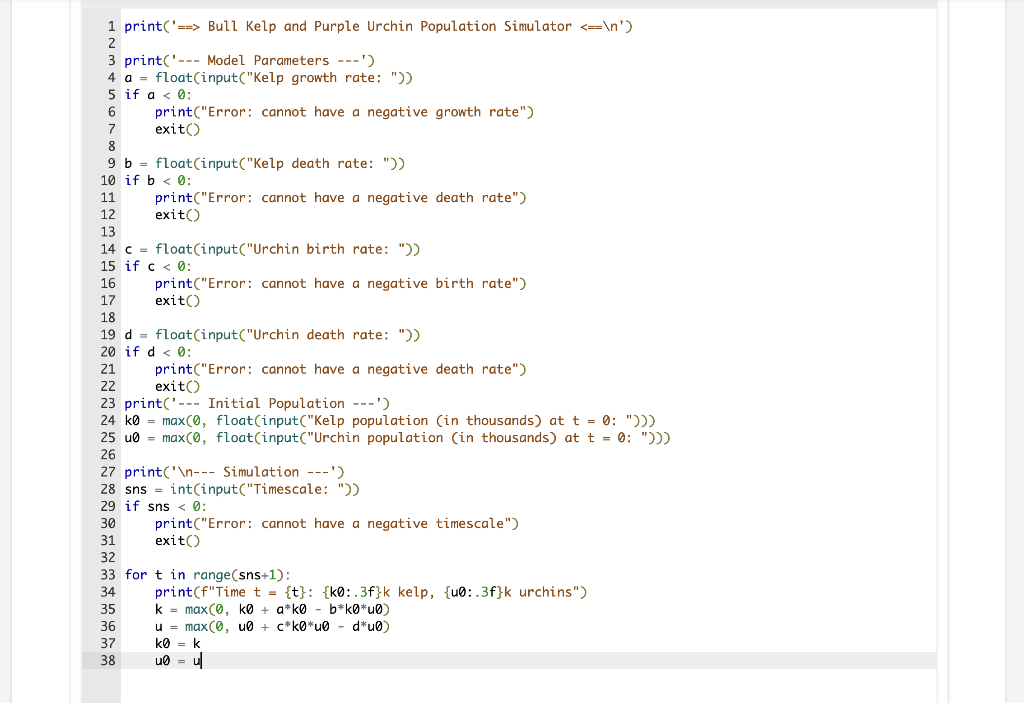
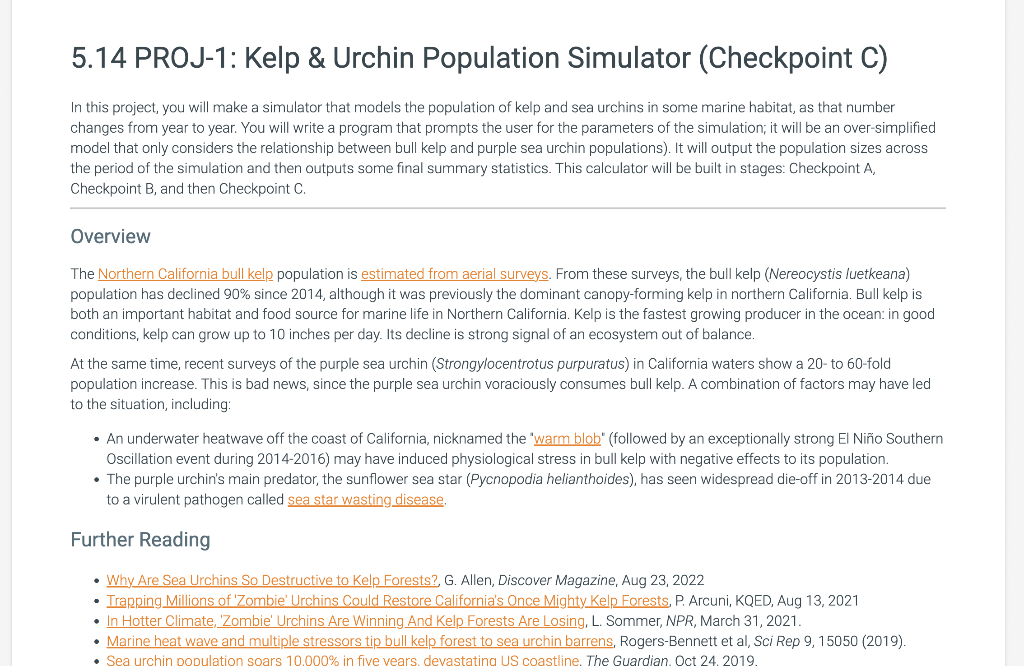
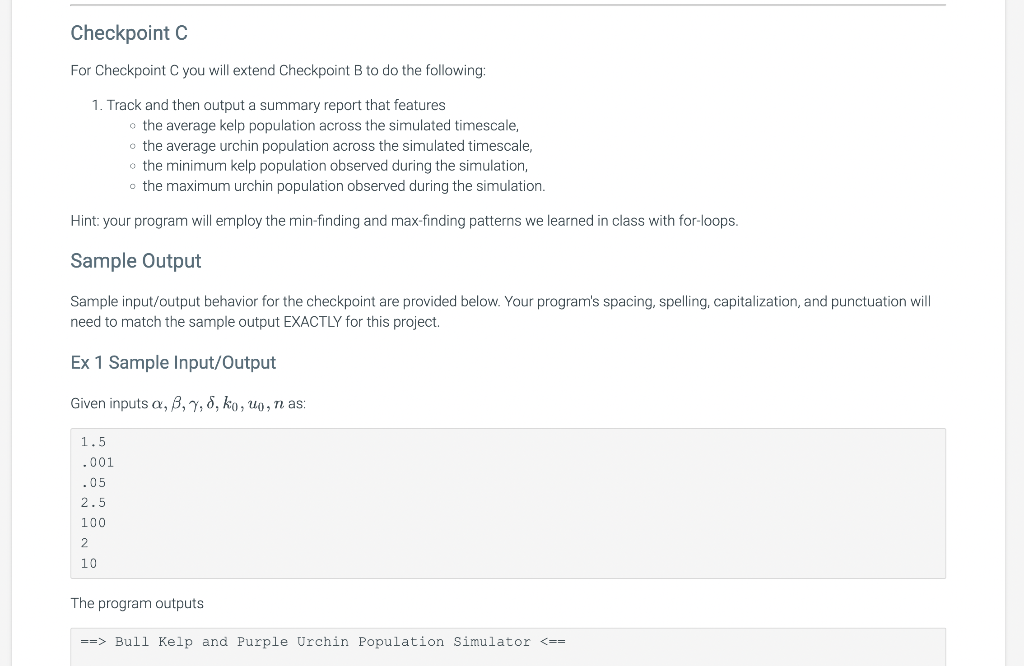
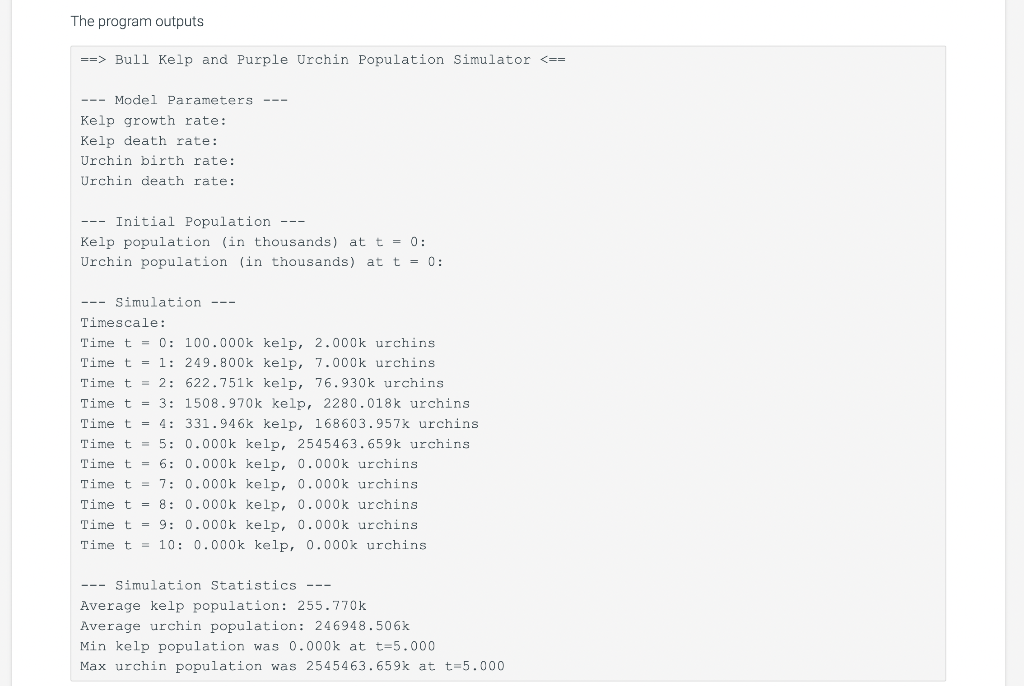
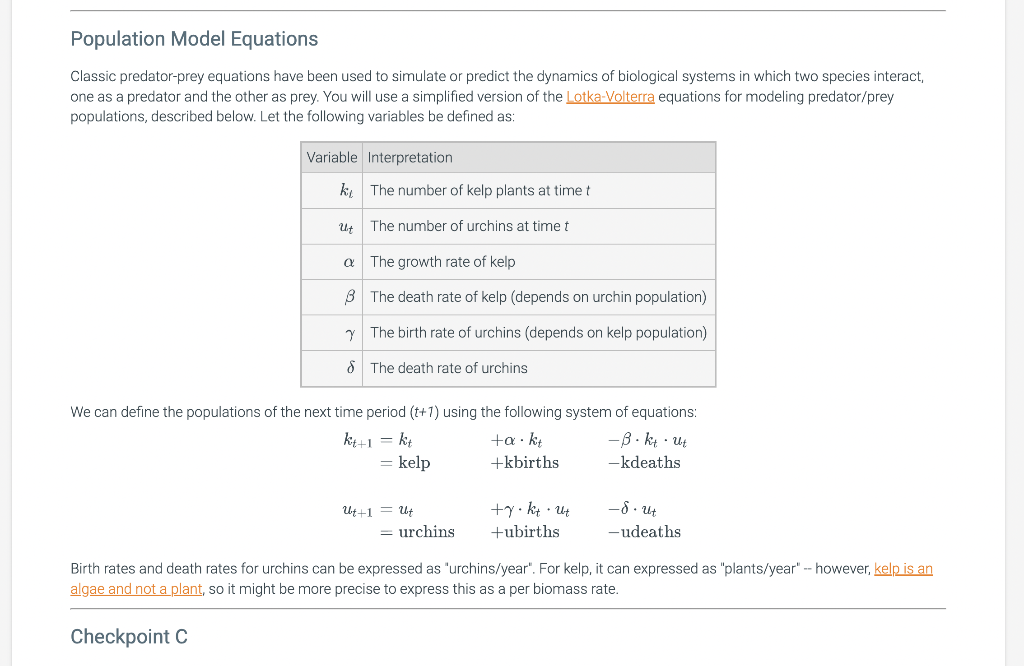
5.14 PROJ-1: Kelp \& Urchin Population Simulator (Checkpoint C) In this project, you will make a simulator that models the population of kelp and sea urchins in some marine habitat, as that number changes from year to year. You will write a program that prompts the user for the parameters of the simulation; it will be an over-simplified model that only considers the relationship between bull kelp and purple sea urchin populations). It will output the population sizes across the period of the simulation and then outputs some final summary statistics. This calculator will be built in stages: Checkpoint A, Checkpoint B, and then Checkpoint C. Overview The Northern California bull kelp population is estimated from aerial surveys. From these surveys, the bull kelp (Nereocystis luetkeana) population has declined 90% since 2014 , although it was previously the dominant canopy-forming kelp in northern California. Bull kelp is both an important habitat and food source for marine life in Northern California. Kelp is the fastest growing producer in the ocean: in good conditions, kelp can grow up to 10 inches per day. Its decline is strong signal of an ecosystem out of balance. At the same time, recent surveys of the purple sea urchin (Strongylocentrotus purpuratus) in California waters show a 20 - to 60 -fold population increase. This is bad news, since the purple sea urchin voraciously consumes bull kelp. A combination of factors may have led to the situation, including: - An underwater heatwave off the coast of California, nicknamed the "warm blob" (followed by an exceptionally strong El Nio Southern Oscillation event during 2014-2016) may have induced physiological stress in bull kelp with negative effects to its population. - The purple urchin's main predator, the sunflower sea star (Pycnopodia helianthoides), has seen widespread die-off in 20132014 due to a virulent pathogen called sea star wasting disease. Further Reading - Why Are Sea Urchins So Destructive to Kelp Forests? G. Allen, Discover Magazine, Aug 23, 2022 - Trapping Millions of 'Zombie' Urchins Could Restore California's Once Mighty Kelp Forests. P. Arcuni, KQED, Aug 13, 2021 - In Hotter Climate, 'Zombie' Urchins Are Winning And Kelp Forests Are Losing, L. Sommer, NPR, March 31, 2021. - Marine heat wave and multiple stressors tip bull kelp forest to sea urchin barrens, Rogers-Bennett et al, Sci Rep 9, 15050 (2019). - Sea urchin pooulation soars 10,000% in five vears, devastating US coastline. The Guardian Oct 24.2019 For Checkpoint C you will extend Checkpoint B to do the following: 1. Track and then output a summary report that features - the average kelp population across the simulated timescale, - the average urchin population across the simulated timescale, - the minimum kelp population observed during the simulation, - the maximum urchin population observed during the simulation. Hint: your program will employ the min-finding and max-finding patterns we learned in class with for-loops. Sample Output Sample input/output behavior for the checkpoint are provided below. Your program's spacing, spelling, capitalization, and punctuation will need to match the sample output EXACTLY for this project. Ex 1 Sample Input/Output Given inputs ,,,,k0,u0,n as: 1.5.001.052.5100210 The program outputs The program outputs Population Model Equations Classic predator-prey equations have been used to simulate or predict the dynamics of biological systems in which two species interact, one as a predator and the other as prey. You will use a simplified version of the Lotka-Volterra equations for modeling predator/prey populations, described below. Let the following variables be defined as: We can define the populations of the next time period (t+1) using the following system of equations: kt+1=kt+ktktut=kelp+kbirthskdeathsut+1=ut+ktutut=urchins+ubirthsudeaths Birth rates and death rates for urchins can be expressed as "urchins/year". For kelp, it can expressed as "plants/year" -- however, kelp is an algae and not a plant, so it might be more precise to express this as a per biomass rate