Question
Need help filling in the following table: Table A. Year = 0 Year = 10 Net Worth $ $ Earnings $ $ Dividends $ $
Need help filling in the following table:
| Table A. | Year = 0 | Year = 10 |
| Net Worth | $ | $ |
| Earnings | $ | $ |
| Dividends | $ | $ |
| Reinvested | $ | $ |
| Offer Value | $ | $ |
| Individual Share (Book) | $ | $ |
| Individual Value (Market) | $ | $ |
---
| Table B. | Year = 0 | Year = 10 |
| Net Worth | $ | $ |
| Earnings | $ | $ |
| Dividends | $ | $ |
| Reinvested | $ | $ |
| Offer Value | $ | $ |
| Individual Share | $ | - |
| BV of Shares Sold | $ | - |
| Value of Shares Sold | $ | - |
| Individual Share (BV) Remaining | $ | $ |
| Individual Value (MV) Remaining | $ | $ |
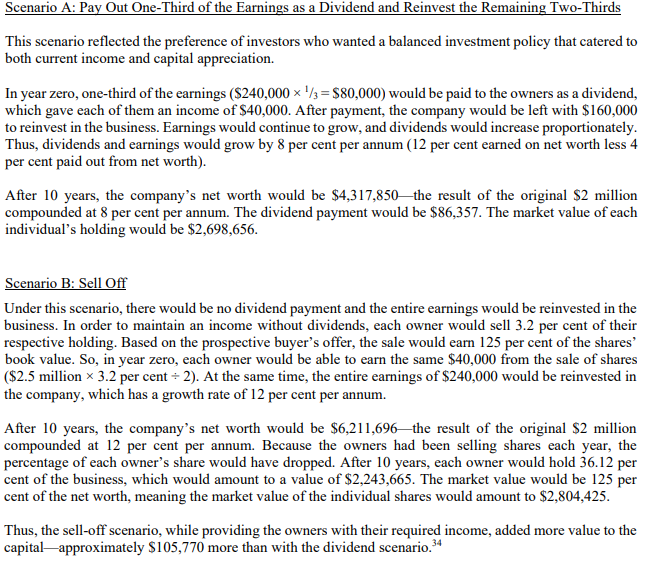
The info can be derived from here (Scenario A for Table A and vise-versa):

Side Notes:
- Individual Share denotes the book value of the individual share, and Individual Value denotes the market value of the individual share.
- In Table B, the basic idea is that each owner needs to sell some stocks (at their market value) to maintain the same income it has under the dividend payment option. You can calculate BV of sold shares and the value of shares sold. Since each owner sells some percentage of their respective holdings, you can then calculate the individual share remaining (BV) and individual value remaining (MV).
- For Individual Share, Book Value of Sold Shares, and Value of Shares Sold in Table B, you only need to fill in the cells when Year = 0 (but not when Year = 10)
- Offer value denotes the market value for the company that an outside buyer is willing to pay for. Thus, it is the same number in Table A and B.
PLEASE INCLUDE ALL CALCULATIONS, THANKS
This scenario reflected the preference of investors who wanted a balanced investment policy that catered to both current income and capital appreciation. In year zero, one-third of the earnings ($240,0001/3=$80,000 ) would be paid to the owners as a dividend, which gave each of them an income of $40,000. After payment, the company would be left with $160,000 to reinvest in the business. Earnings would continue to grow, and dividends would increase proportionately. Thus, dividends and earnings would grow by 8 per cent per annum ( 12 per cent earned on net worth less 4 per cent paid out from net worth). After 10 years, the company's net worth would be $4,317,850 - the result of the original $2 million compounded at 8 per cent per annum. The dividend payment would be $86,357. The market value of each individual's holding would be $2,698,656. Scenario B: Sell Off Under this scenario, there would be no dividend payment and the entire earnings would be reinvested in the business. In order to maintain an income without dividends, each owner would sell 3.2 per cent of their respective holding. Based on the prospective buyer's offer, the sale would earn 125 per cent of the shares' book value. So, in year zero, each owner would be able to earn the same $40,000 from the sale of shares ( $2.5 million 3.2 per cent 2 ). At the same time, the entire earnings of $240,000 would be reinvested in the company, which has a growth rate of 12 per cent per annum. After 10 years, the company's net worth would be $6,211,696 - the result of the original $2 million compounded at 12 per cent per annum. Because the owners had been selling shares each year, the percentage of each owner's share would have dropped. After 10 years, each owner would hold 36.12 per cent of the business, which would amount to a value of $2,243,665. The market value would be 125 per cent of the net worth, meaning the market value of the individual shares would amount to $2,804,425. Thus, the sell-off scenario, while providing the owners with their required income, added more value to the capital-approximately $105,770 more than with the dividend scenario. 34 This scenario reflected the preference of investors who wanted a balanced investment policy that catered to both current income and capital appreciation. In year zero, one-third of the earnings ($240,0001/3=$80,000 ) would be paid to the owners as a dividend, which gave each of them an income of $40,000. After payment, the company would be left with $160,000 to reinvest in the business. Earnings would continue to grow, and dividends would increase proportionately. Thus, dividends and earnings would grow by 8 per cent per annum ( 12 per cent earned on net worth less 4 per cent paid out from net worth). After 10 years, the company's net worth would be $4,317,850 - the result of the original $2 million compounded at 8 per cent per annum. The dividend payment would be $86,357. The market value of each individual's holding would be $2,698,656. Scenario B: Sell Off Under this scenario, there would be no dividend payment and the entire earnings would be reinvested in the business. In order to maintain an income without dividends, each owner would sell 3.2 per cent of their respective holding. Based on the prospective buyer's offer, the sale would earn 125 per cent of the shares' book value. So, in year zero, each owner would be able to earn the same $40,000 from the sale of shares ( $2.5 million 3.2 per cent 2 ). At the same time, the entire earnings of $240,000 would be reinvested in the company, which has a growth rate of 12 per cent per annum. After 10 years, the company's net worth would be $6,211,696 - the result of the original $2 million compounded at 12 per cent per annum. Because the owners had been selling shares each year, the percentage of each owner's share would have dropped. After 10 years, each owner would hold 36.12 per cent of the business, which would amount to a value of $2,243,665. The market value would be 125 per cent of the net worth, meaning the market value of the individual shares would amount to $2,804,425. Thus, the sell-off scenario, while providing the owners with their required income, added more value to the capital-approximately $105,770 more than with the dividend scenario. 34Step by Step Solution
There are 3 Steps involved in it
Step: 1

Get Instant Access to Expert-Tailored Solutions
See step-by-step solutions with expert insights and AI powered tools for academic success
Step: 2

Step: 3

Ace Your Homework with AI
Get the answers you need in no time with our AI-driven, step-by-step assistance
Get Started


