

Answered step by step
Verified Expert Solution
Question
1 Approved Answer
Need help for question 8 Consort, Inc.: Utilizing Consolidation to Lower Transportation Costs do is to subsidize the other customers of MT Freight Forwarding. We
Need help for question 8
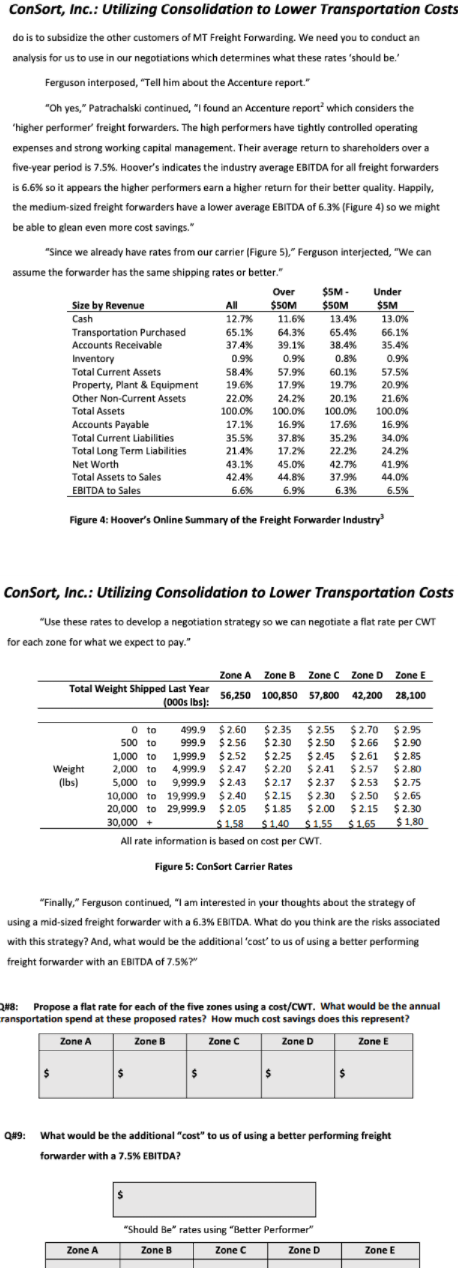
Consort, Inc.: Utilizing Consolidation to Lower Transportation Costs do is to subsidize the other customers of MT Freight Forwarding. We need you to conduct an analysis for us to use in our negotiations which determines what these rates should be Ferguson interposed, "Tell him about the Accenture report." "Oh yes," Patrachalski continued, "I found an Accenture report which considers the "higher performer' freight forwarders. The high performers have tightly controlled operating expenses and strong working capital management. Their average return to shareholders over a . five-year period is 7.5%. Hoover's indicates the industry average EBITDA for all freight forwarders is 6.6% so it appears the higher performers earn a higher return for their better quality. Happily, the medium-sized freight forwarders have a lower average EBITDA of 6.3% (Figure 4) so we might be able to glean even more cost savings." "Since we already have rates from our carrier (Figure 5)," Ferguson interjected, "We can assume the forwarder has the same shipping rates or better." Over $5M Under Size by Revenue All $50M $50M $5M Cash 12.7% 11.6% 13.4% 13.0% Transportation Purchased 65.1% 64.3% 65.4% 66.1% Accounts Receivable 37.4% 39.1% 38.4% 35.4% Inventory 0.9% 0.9% 0.8% 0.9% Total Current Assets 58.4% 57.9% 60.1% 57.5% Property, Plant & Equipment 19.6% 17.9% 19.7% 20.9% Other Non-Current Assets 22.0% 24.2% 20.1% 21.6% Total Assets 100.0% 100.0% 100.0% 100.0% Accounts Payable 17.1% 16.9% 17.6% 16.9% Total Current Liabilities 35.5% 37.8% 35.2% 34.0% Total Long Term Liabilities 21.4% 17.2% 22.2% 24.2% Net Worth 43.1% 45.0% 42.7% 41.9% Total Assets to Sales 42.4% 44.8% 44.0% EBITDA to Sales 6.6% 6.9% 6.3% 6.5% 37.9% Figure 4: Hoover's Online Summary of the Freight Forwarder Industry ConSort, Inc.: Utilizing Consolidation to Lower Transportation Costs "Use these rates to develop a negotiation strategy so we can negotiate a flat rate per CWT for each zone for what we expect to pay." " Zone A Zone B Zone C Zone D Zone E Total Weight Shipped Last Year (000s lbs): 56,250 100,850 57,800 42,200 28,100 Weight (lbs) O to 499.9 $ 2.60 $ 2.35 $ 2.55 500 to 999.9 $2.56 $ 2.30 $ 2.50 1,000 to 1,999.9 $2.52 $ 2.25 $ 2.45 2,000 to 4,999.9 $2.47 $ 2.20 $ 2.41 5,000 to 9,999.9 $2.43 $ 2.17 $ 2.37 10,000 to 19,999.9 $2.40 $ 2.15 $ 2.30 20,000 to 29,999.9 $2.05 $ 1.85 $2.00 30,000 + $ 1.58 $ 1.40 $ 1.55 All rate information is based on cost per CWT. $ 2.70 $ 2.95 $ 2.66 $ 2.90 $ 2.61 $2.85 $ 2.57 $ 2.80 $2.53 $ 2.75 $2.50 $ 2.65 $ 2.15 $ 2.30 $ 1,65 $ 1,80 Figure 5: ConSort Carrier Rates "Finally," Ferguson continued, "I am interested in your thoughts about the strategy of using a mid-sized freight forwarder with a 6.3% EBITDA. What do you think are the risks associated with this strategy? And, what would be the additional cost' to us of using a better performing freight forwarder with an EBITDA of 7.5%? 2#8: Propose a flat rate for each of the five zones using a cost/CWT. What would be the annual ransportation spend at these proposed rates? How much cost savings does this represent? Zone A Zone B Zone C Zone D Zone E $ $ $ $ $ Q49: What would be the additional "cost" to us of using a better performing freight forwarder with a 7.5% EBITDA? "Should Be rates using "Better Performer" Zone B Zone C C Zone D Zone A Zone E Consort, Inc.: Utilizing Consolidation to Lower Transportation Costs do is to subsidize the other customers of MT Freight Forwarding. We need you to conduct an analysis for us to use in our negotiations which determines what these rates should be Ferguson interposed, "Tell him about the Accenture report." "Oh yes," Patrachalski continued, "I found an Accenture report which considers the "higher performer' freight forwarders. The high performers have tightly controlled operating expenses and strong working capital management. Their average return to shareholders over a . five-year period is 7.5%. Hoover's indicates the industry average EBITDA for all freight forwarders is 6.6% so it appears the higher performers earn a higher return for their better quality. Happily, the medium-sized freight forwarders have a lower average EBITDA of 6.3% (Figure 4) so we might be able to glean even more cost savings." "Since we already have rates from our carrier (Figure 5)," Ferguson interjected, "We can assume the forwarder has the same shipping rates or better." Over $5M Under Size by Revenue All $50M $50M $5M Cash 12.7% 11.6% 13.4% 13.0% Transportation Purchased 65.1% 64.3% 65.4% 66.1% Accounts Receivable 37.4% 39.1% 38.4% 35.4% Inventory 0.9% 0.9% 0.8% 0.9% Total Current Assets 58.4% 57.9% 60.1% 57.5% Property, Plant & Equipment 19.6% 17.9% 19.7% 20.9% Other Non-Current Assets 22.0% 24.2% 20.1% 21.6% Total Assets 100.0% 100.0% 100.0% 100.0% Accounts Payable 17.1% 16.9% 17.6% 16.9% Total Current Liabilities 35.5% 37.8% 35.2% 34.0% Total Long Term Liabilities 21.4% 17.2% 22.2% 24.2% Net Worth 43.1% 45.0% 42.7% 41.9% Total Assets to Sales 42.4% 44.8% 44.0% EBITDA to Sales 6.6% 6.9% 6.3% 6.5% 37.9% Figure 4: Hoover's Online Summary of the Freight Forwarder Industry ConSort, Inc.: Utilizing Consolidation to Lower Transportation Costs "Use these rates to develop a negotiation strategy so we can negotiate a flat rate per CWT for each zone for what we expect to pay." " Zone A Zone B Zone C Zone D Zone E Total Weight Shipped Last Year (000s lbs): 56,250 100,850 57,800 42,200 28,100 Weight (lbs) O to 499.9 $ 2.60 $ 2.35 $ 2.55 500 to 999.9 $2.56 $ 2.30 $ 2.50 1,000 to 1,999.9 $2.52 $ 2.25 $ 2.45 2,000 to 4,999.9 $2.47 $ 2.20 $ 2.41 5,000 to 9,999.9 $2.43 $ 2.17 $ 2.37 10,000 to 19,999.9 $2.40 $ 2.15 $ 2.30 20,000 to 29,999.9 $2.05 $ 1.85 $2.00 30,000 + $ 1.58 $ 1.40 $ 1.55 All rate information is based on cost per CWT. $ 2.70 $ 2.95 $ 2.66 $ 2.90 $ 2.61 $2.85 $ 2.57 $ 2.80 $2.53 $ 2.75 $2.50 $ 2.65 $ 2.15 $ 2.30 $ 1,65 $ 1,80 Figure 5: ConSort Carrier Rates "Finally," Ferguson continued, "I am interested in your thoughts about the strategy of using a mid-sized freight forwarder with a 6.3% EBITDA. What do you think are the risks associated with this strategy? And, what would be the additional cost' to us of using a better performing freight forwarder with an EBITDA of 7.5%? 2#8: Propose a flat rate for each of the five zones using a cost/CWT. What would be the annual ransportation spend at these proposed rates? How much cost savings does this represent? Zone A Zone B Zone C Zone D Zone E $ $ $ $ $ Q49: What would be the additional "cost" to us of using a better performing freight forwarder with a 7.5% EBITDA? "Should Be rates using "Better Performer" Zone B Zone C C Zone D Zone A Zone EStep by Step Solution
There are 3 Steps involved in it
Step: 1

Get Instant Access to Expert-Tailored Solutions
See step-by-step solutions with expert insights and AI powered tools for academic success
Step: 2

Step: 3
Ace Your Homework with AI
Get the answers you need in no time with our AI-driven, step-by-step assistance
Get Started
Auditing Explained A Practical Guide For Managers
Authors: John Dunn
1st Edition
0749405619, 978-0749405618