

Answered step by step
Verified Expert Solution
Question
1 Approved Answer
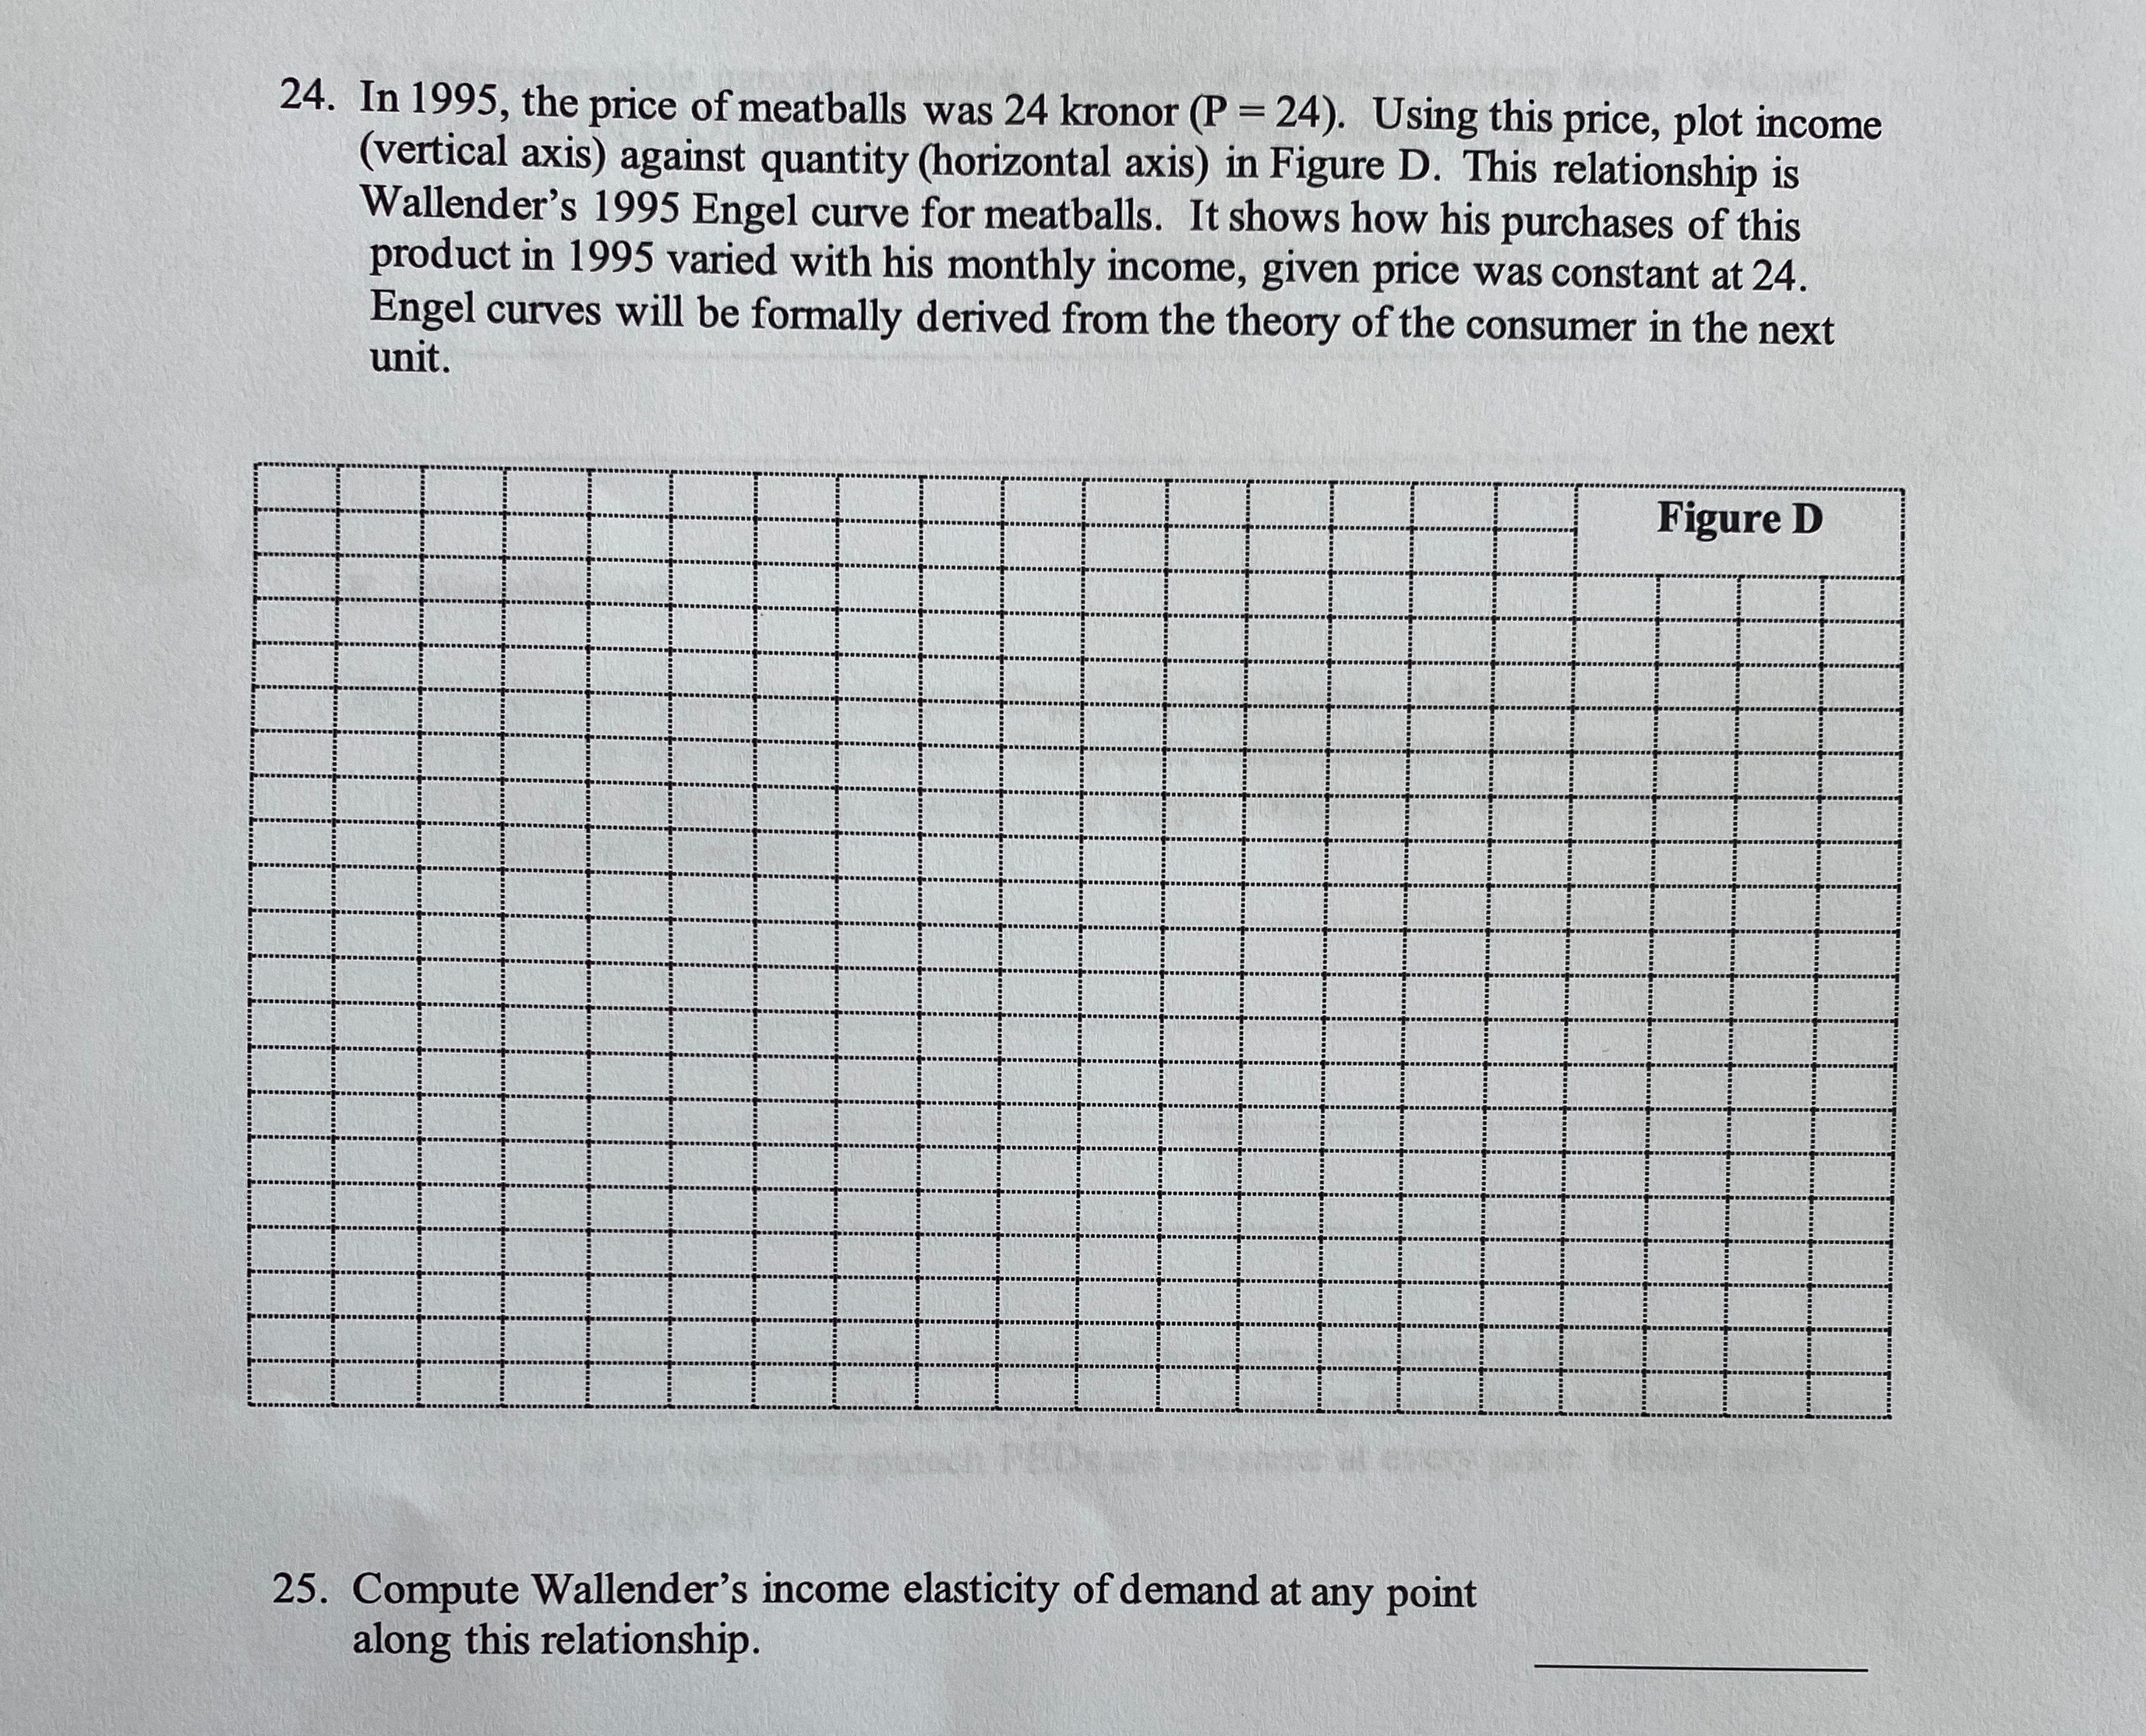
Need help graphing and labeling axis points !!! Thanks 24. In 1995, the price of meatballs was 24 kronor (P - 24). Using this price,
Need help graphing and labeling axis points !!! Thanks
Step by Step Solution
There are 3 Steps involved in it
Step: 1

Get Instant Access to Expert-Tailored Solutions
See step-by-step solutions with expert insights and AI powered tools for academic success
Step: 2

Step: 3
Ace Your Homework with AI
Get the answers you need in no time with our AI-driven, step-by-step assistance
Get Started
Macroeconomics Principles Applications And Tools
Authors: Arthur O Sullivan, Steven M. Sheffrin, Stephen J. Perez
7th Edition
978-0134089034, 9780134062754, 134089030, 134062752, 978-0132555234