

Answered step by step
Verified Expert Solution
Question
1 Approved Answer
Need help learning how to solve this 2020 2021 2022 2023 2024 10.1% 9.6% 9.1% 8.1% Sales growth rate Operating costs as a % of
Need help learning how to solve this
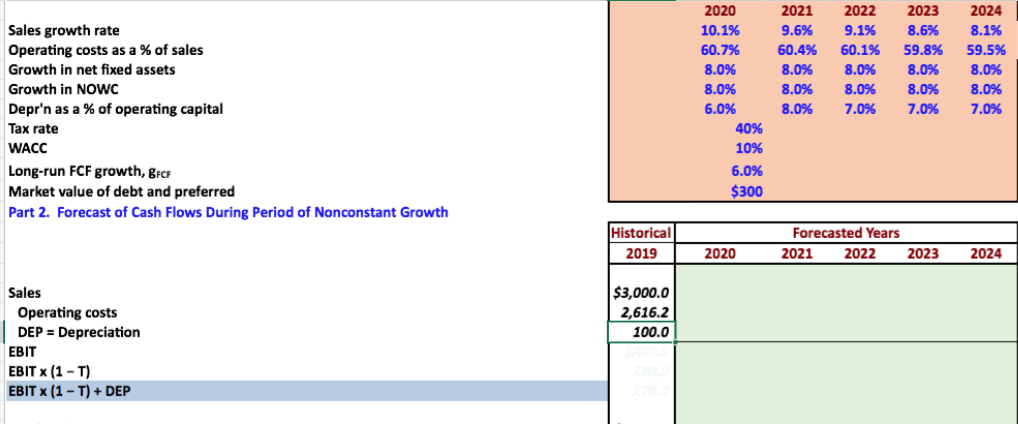
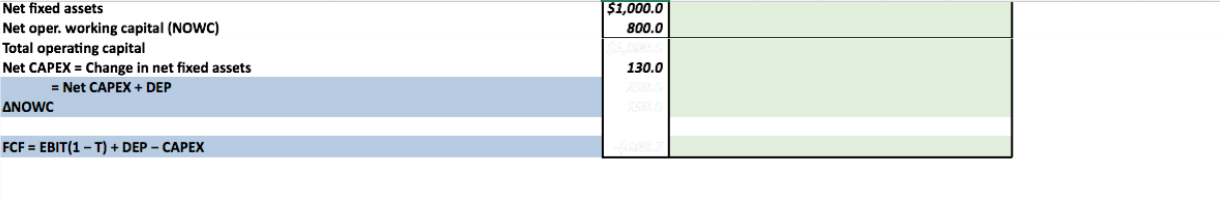
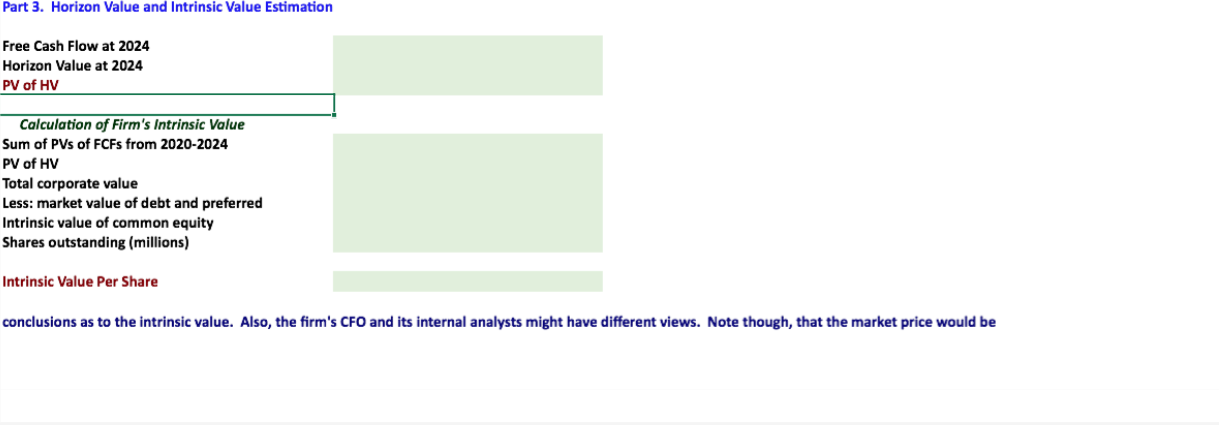
2020 2021 2022 2023 2024 10.1% 9.6% 9.1% 8.1% Sales growth rate Operating costs as a % of sales Growth in net fixed assets 8.6% 59.8% 60.7% 60.4% 60.1% 59.5% 8.0% 8.0% 8.0% 8.0% 8.0% Growth in NOWC 8.0% 8.0% 8.0% 8.0% 8.0% 6.0% 8.0% 7.0% 7.0% 7.0% Depr'n as a % of operating capital Tax rate 40% WACC 10% Long-run FCF growth, Beck Market value of debt and preferred Part 2. Forecast of Cash Flows During Period of Nonconstant Growth 6.0% $300 Historical Forecasted Years 2019 2020 2021 2022 2023 2024 $3,000.0 2,616.2 100.0 Sales Operating costs DEP - Depreciation EBIT EBIT (1-T) EBIT x (1 - T) + DEP $1,000.0 800.0 Net fixed assets Net oper. working capital (NOWC) Total operating capital Net CAPEX = Change in net fixed assets = Net CAPEX + DEP 130.0 ANOWC FCF = EBIT(1 - T) + DEP - CAPEX Part 3. Horizon Value and Intrinsic Value Estimation Free Cash Flow at 2024 Horizon Value at 2024 PV of HV Calculation of Firm's Intrinsic Value Sum of PVs of FCFs from 2020-2024 PV of HV Total corporate value Less: market value of debt and preferred Intrinsic value of common equity Shares outstanding (millions) Intrinsic Value Per Share conclusions as to the intrinsic value. Also, the firm's CFO and its internal analysts might have different views. Note though, that the market price would be 2020 2021 2022 2023 2024 10.1% 9.6% 9.1% 8.1% Sales growth rate Operating costs as a % of sales Growth in net fixed assets 8.6% 59.8% 60.7% 60.4% 60.1% 59.5% 8.0% 8.0% 8.0% 8.0% 8.0% Growth in NOWC 8.0% 8.0% 8.0% 8.0% 8.0% 6.0% 8.0% 7.0% 7.0% 7.0% Depr'n as a % of operating capital Tax rate 40% WACC 10% Long-run FCF growth, Beck Market value of debt and preferred Part 2. Forecast of Cash Flows During Period of Nonconstant Growth 6.0% $300 Historical Forecasted Years 2019 2020 2021 2022 2023 2024 $3,000.0 2,616.2 100.0 Sales Operating costs DEP - Depreciation EBIT EBIT (1-T) EBIT x (1 - T) + DEP $1,000.0 800.0 Net fixed assets Net oper. working capital (NOWC) Total operating capital Net CAPEX = Change in net fixed assets = Net CAPEX + DEP 130.0 ANOWC FCF = EBIT(1 - T) + DEP - CAPEX Part 3. Horizon Value and Intrinsic Value Estimation Free Cash Flow at 2024 Horizon Value at 2024 PV of HV Calculation of Firm's Intrinsic Value Sum of PVs of FCFs from 2020-2024 PV of HV Total corporate value Less: market value of debt and preferred Intrinsic value of common equity Shares outstanding (millions) Intrinsic Value Per Share conclusions as to the intrinsic value. Also, the firm's CFO and its internal analysts might have different views. Note though, that the market price would beStep by Step Solution
There are 3 Steps involved in it
Step: 1

Get Instant Access to Expert-Tailored Solutions
See step-by-step solutions with expert insights and AI powered tools for academic success
Step: 2

Step: 3
Ace Your Homework with AI
Get the answers you need in no time with our AI-driven, step-by-step assistance
Get Started
Principles Of Commercial Real Estate Finance
Authors: Gail Ramshaw, Mortgage Bank
1st Edition
0793157099, 9780793157099