Need help on Part II only, thanks!

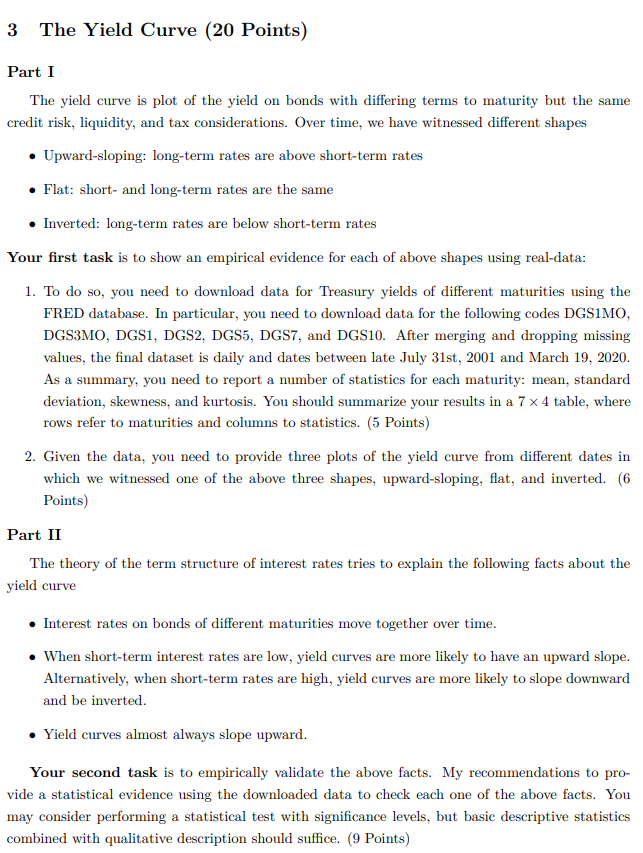
3 The Yield Curve (20 Points) Part I The yield curve is plot of the yield on bonds with differing terms to maturity but the same credit risk, liquidity, and tax considerations. Over time, we have witnessed different shapes Upward-sloping: long-term rates are above short-term rates . Flat: short- and long-term rates are the same Inverted: long-term rates are below short-term rates Your first task is to show an empirical evidence for each of above shapes using real-data: 1. To do so, you need to download data for Treasury yields of different maturities using the FRED database. In particular, you need to download data for the following codes DGSIMO, DGS3MO, DGS1, DS2, DGS5, DGS7, and DGS10. After merging and dropping missing values, the final dataset is daily and dates between late July 31st, 2001 and March 19, 2020. As a summary, you need to report a number of statistics for each maturity: mean, standard deviation, skewness, and kurtosis. You should summarize your results in a 7 x 4 table, where rows refer to maturities and columns to statistics. (5 Points) 2. Given the data, you need to provide three plots of the yield curve from different dates in which we witnessed one of the above three shapes, upward-sloping, flat, and inverted. (6 Points) Part II The theory of the term structure of interest rates tries to explain the following facts about the yield curve Interest rates on bonds of different maturities move together over time. When short-term interest rates are low, yield curves are more likely to have an upward slope. Alternatively, when short-term rates are high, yield curves are more likely to slope downward and be inverted. Yield curves almost always slope upward. Your second task is to empirically validate the above facts. My recommendations to pro- vide a statistical evidence using the downloaded data to check each one of the above facts. You may consider performing a statistical test with significance levels, but basic descriptive statistics combined with qualitative description should suffice. (9 Points) 3 The Yield Curve (20 Points) Part I The yield curve is plot of the yield on bonds with differing terms to maturity but the same credit risk, liquidity, and tax considerations. Over time, we have witnessed different shapes Upward-sloping: long-term rates are above short-term rates . Flat: short- and long-term rates are the same Inverted: long-term rates are below short-term rates Your first task is to show an empirical evidence for each of above shapes using real-data: 1. To do so, you need to download data for Treasury yields of different maturities using the FRED database. In particular, you need to download data for the following codes DGSIMO, DGS3MO, DGS1, DS2, DGS5, DGS7, and DGS10. After merging and dropping missing values, the final dataset is daily and dates between late July 31st, 2001 and March 19, 2020. As a summary, you need to report a number of statistics for each maturity: mean, standard deviation, skewness, and kurtosis. You should summarize your results in a 7 x 4 table, where rows refer to maturities and columns to statistics. (5 Points) 2. Given the data, you need to provide three plots of the yield curve from different dates in which we witnessed one of the above three shapes, upward-sloping, flat, and inverted. (6 Points) Part II The theory of the term structure of interest rates tries to explain the following facts about the yield curve Interest rates on bonds of different maturities move together over time. When short-term interest rates are low, yield curves are more likely to have an upward slope. Alternatively, when short-term rates are high, yield curves are more likely to slope downward and be inverted. Yield curves almost always slope upward. Your second task is to empirically validate the above facts. My recommendations to pro- vide a statistical evidence using the downloaded data to check each one of the above facts. You may consider performing a statistical test with significance levels, but basic descriptive statistics combined with qualitative description should suffice. (9 Points)


