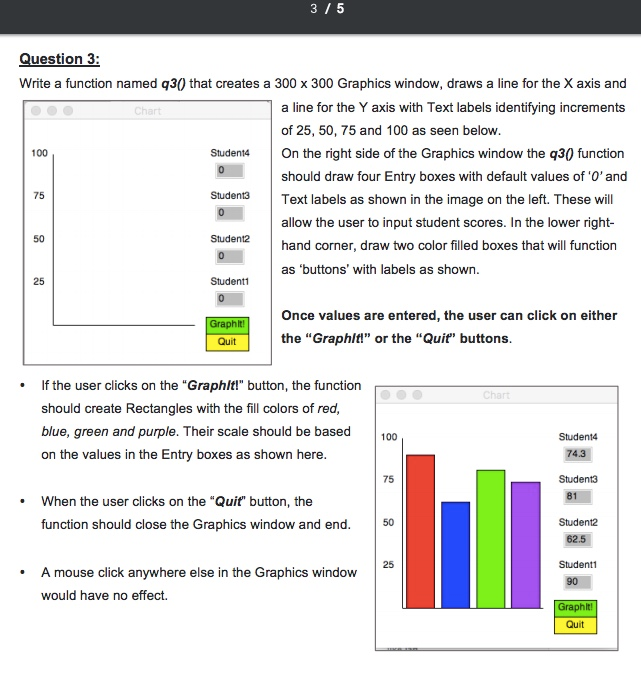
Question
Need help on python http://mcsp.wartburg.edu/zelle/python/graphics.py You need this libary. this is my code. I dont get the int value from entry code: from graphics import
Need help on python
http://mcsp.wartburg.edu/zelle/python/graphics.py
You need this libary.
this is my code. I dont get the int value from entry
code:
from graphics import * import math # TODO #1: def q3(): # Build the Dartboard win = GraphWin("Chart",300,300) xLine=Line(Point(50,250),Point(250,250)) xLine.draw(win) yLine=Line(Point(50,250),Point(50,50)) yLine.draw(win) message = Text(Point(30,200),"25") message.setSize(10) message.draw(win) message = Text(Point(30,150),"50") message.setSize(10) message.draw(win) message = Text(Point(30,100),"75") message.setSize(10) message.draw(win) message = Text(Point(30,50),"100") message.setSize(10) message.draw(win)
student4 = Entry(Point(270,50),4) student4.draw(win) text1=student4.getText() text2=int(text1) message = Text(Point(270,27),"Student4") message.setSize(10) message.draw(win)
student3 = Entry(Point(270,100),4) student3.draw(win) message = Text(Point(270,77),"Student3") message.setSize(10) message.draw(win)
student2 = Entry(Point(270,150),4) student2.draw(win) message = Text(Point(270,127),"Student2") message.setSize(10) message.draw(win)
student1 = Entry(Point(270,200),4) student1.draw(win ) message = Text(Point(270,177),"Student1") message.setSize(10) message.draw(win)
rect1= Rectangle(Point(55,250),Point(80,(text2)*2)-250) rect1.draw(win) rect1.setFill("black") rect2= Rectangle(Point(85,250),Point(110,2)) rect2.draw(win) rect3= Rectangle(Point(115,250),Point(140,*2)) rect3.draw(win) rect4= Rectangle(Point(145,250),Point(170,*2)) rect4.draw(win) q3()

Step by Step Solution
There are 3 Steps involved in it
Step: 1

Get Instant Access to Expert-Tailored Solutions
See step-by-step solutions with expert insights and AI powered tools for academic success
Step: 2

Step: 3

Ace Your Homework with AI
Get the answers you need in no time with our AI-driven, step-by-step assistance
Get Started


