

Question
Need help on the red highlight I already answered the others I'm a little confused (i put the others just in case for info) 1.
Need help on the red highlight I already answered the others I'm a little confused (i put the others just in case for info)
1. the market value of debt(use bond schedule for 05/31/21 - use value in BILLIONS)
2. what is the average tax rate (use average for most recent six calendar years = there are two acceptable ways to calculate this that result in two slightly different answers)
3. what is the pre tax of debt (bonds) (use bond schedule for 05/31/21 - use value in BILLIONS)
4. what is Total market value of equity and debt (use value in BILLIONS)
5. what is Weight for equity?
6. what is the weight for debt?
7. what is the weighted average cost of capital?
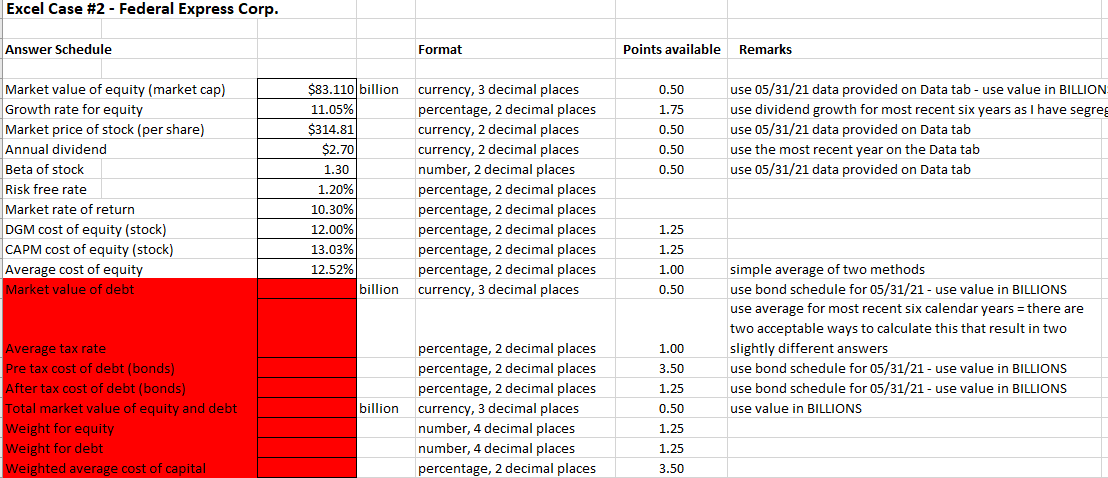
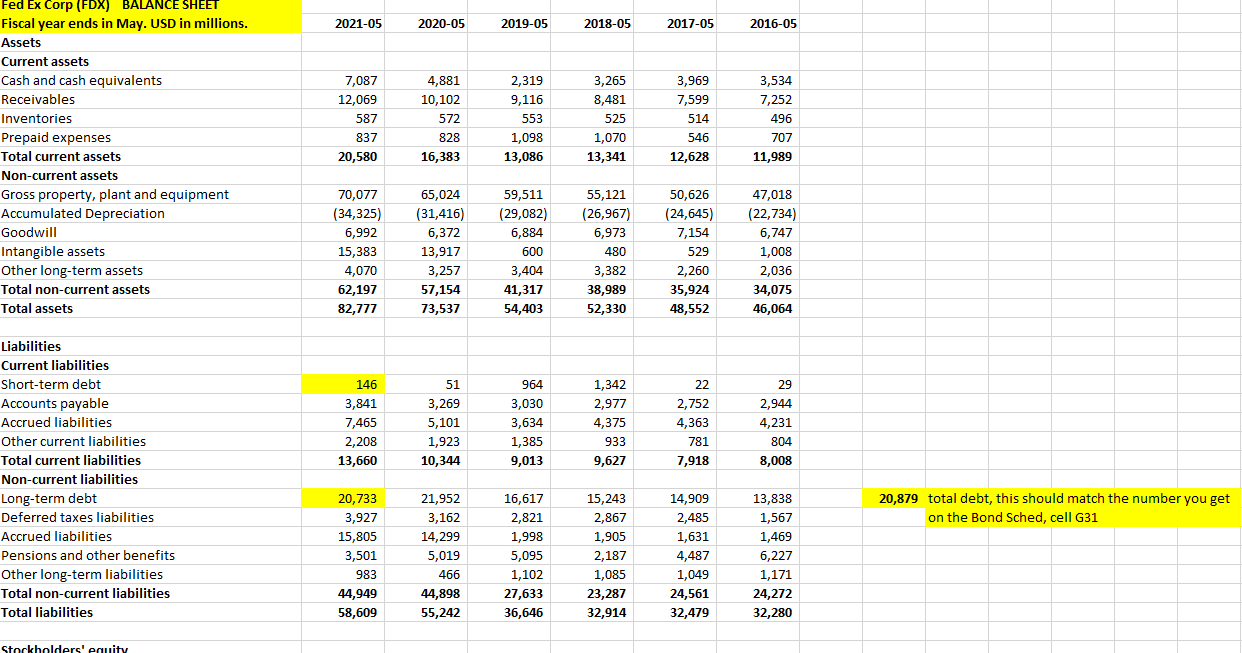
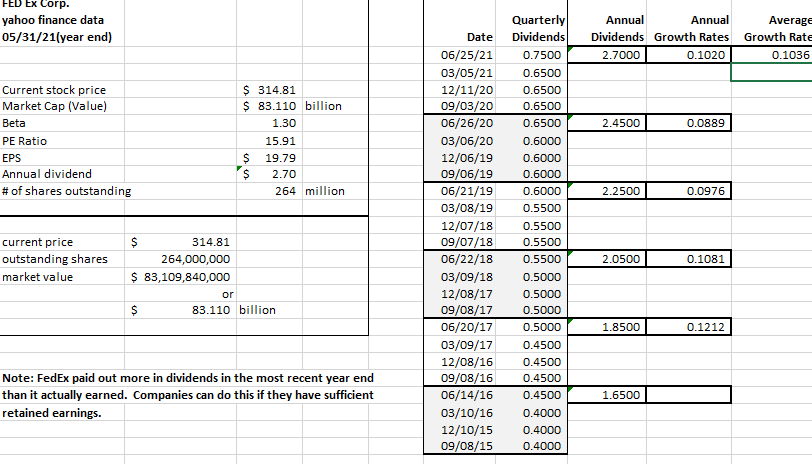
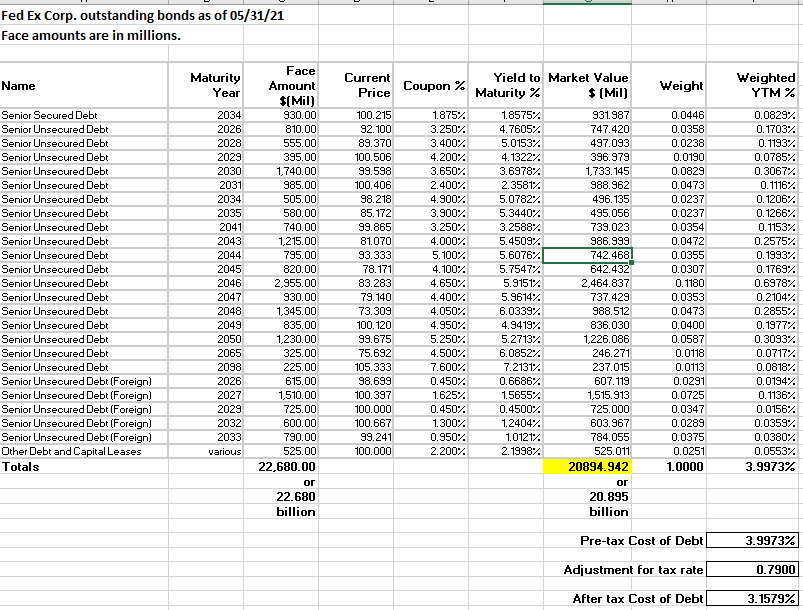
Excel Case #2 - Federal Express Corp. Answer Schedule Format Points available Remarks 0.50 1.75 0.50 0.50 0.50 use 05/31/21 data provided on Data tab-use value in BILLION use dividend growth for most recent six years as I have segreg use 05/31/21 data provided on Data tab use the most recent year on the Data tab use 05/31/21 data provided on Data tab Market value of equity (market cap) Growth rate for equity Market price of stock (per share) Annual dividend Beta of stock Risk free rate Market rate of return DGM cost of equity (stock) CAPM cost of equity (stock) Average cost of equity Market value of debt $83.110 billion currency, 3 decimal places 11.05% percentage, 2 decimal places $314.81 currency, 2 decimal places $2.70 currency, 2 decimal places 1.30 number, 2 decimal places 1.20% percentage, 2 decimal places 10.30% percentage, 2 decimal places 12.00% percentage, 2 decimal places 13.03% percentage, 2 decimal places 12.52% percentage, 2 decimal places billion currency, 3 decimal places 1.25 1.25 1.00 0.50 simple average of two methods use bond schedule for 05/31/21 - use value in BILLIONS use average for most recent six calendar years = there are two acceptable ways to calculate this that result in two slightly different answers use bond schedule for 05/31/21 - use value in BILLIONS use bond schedule for 05/31/21 - use value in BILLIONS use value in BILLIONS Average tax rate Pre tax cost of debt (bonds) After tax cost of debt (bonds) Total market value of equity and debt Weight for equity Weight for debt Weighted average cost of capital billion percentage, 2 decimal places percentage, 2 decimal places percentage, 2 decimal places currency, 3 decimal places number, 4 decimal places number, 4 decimal places percentage, 2 decimal places 1.00 3.50 1.25 0.50 1.25 1.25 3.50 2021-05 2020-05 2019-05 2018-05 2017-05 2016-05 7,087 12,069 587 Fed Ex Corp (FDX) BALANCE SHEET Fiscal year ends in May. USD in millions. Assets Current assets Cash and cash equivalents Receivables Inventories Prepaid expenses Total current assets Non-current assets - Gross property, plant and equipment Accumulated Depreciation Goodwill Intangible assets Other long-term assets Total non-current assets Total assets 4,881 10,102 572 828 16,383 2,319 9,116 553 1,098 13,086 3,265 8,481 525 1,070 13,341 3,969 7,599 514 546 12,628 3,534 7,252 496 707 11,989 837 20,580 70,077 (34,325) 6,992 15,383 4,070 62,197 82,777 65,024 (31,416) 6,372 13,917 3,257 57,154 73,537 59,511 (29,082) 6,884 600 3,404 41,317 54,403 55,121 (26,967) 6,973 480 3,382 50,626 (24,645) 7,154 529 2,260 35,924 48,552 47,018 (22,734) 6,747 1,008 2,036 34,075 46,064 38,989 52,330 146 3,841 7,465 2,208 13,660 51 3,269 5,101 1,923 10,344 964 3,030 3,634 1,385 9,013 1,342 2,977 4,375 933 9,627 22 2,752 4,363 781 7,918 29 2,944 4,231 804 8,008 Liabilities Current liabilities Short-term debt Accounts payable Accrued liabilities Other current liabilities Total current liabilities Non-current liabilities Long-term debt Deferred taxes liabilities Accrued liabilities Pensions and other benefits Other long-term liabilities Total non-current liabilities Total liabilities 20,879 total debt, this should match the number you get on the Bond Sched, cell G31 20,733 3,927 15,805 3,501 983 44,949 58,609 21,952 3,162 14,299 5,019 466 44,898 55,242 16,617 2,821 1,998 5,095 1,102 27,633 36,646 15,243 2,867 1,905 2,187 1,085 23,287 32,914 14,909 2,485 1,631 4,487 1,049 24,561 32,479 13,838 1,567 1,469 6,227 1,171 24,272 32,280 Stockholders' equity Ex Corp. yahoo finance data 05/31/21 year end) Annual Annual Dividends Growth Rates 2.7000 0.1020 Average Growth Rate 0.1036 2.4500 0.0889 Current stock price Market Cap (value) Beta PE Ratio EPS Annual dividend # of shares outstanding $ 314.81 $ 83.110 billion 1.30 15.91 $ 19.79 $ 2.70 264 million 2.2500 0.0976 Quarterly Dividends 0.7500 0.6500 0.6500 0.6500 0.6500 0.6000 0.6000 0.6000 0.6000 0.5500 0.5500 0.5500 0.5500 0.5000 0.5000 0.5000 0.5000 0.4500 0.4500 0.4500 0.4500 0.4000 0.4000 0.4000 current price outstanding shares market value Date 06/25/21 03/05/21 12/11/20 09/03/20 06/26/20 03/06/20 12/06/19 09/06/19 06/21/19 03/08/19 12/07/18 09/07/18 06/22/18 03/09/18 12/08/17 09/08/17 06/20/17 03/09/17 12/08/16 09/08/16 06/14/16 03/10/16 12/10/15 09/08/15 2.0500 $ 314.81 264,000,000 $ 83,109,840,000 or $ 83.110 billion 0.1081 1.8500 0.1212 Note: FedEx paid out more in dividends in the most recent year end than it actually earned. Companies can do this if they have sufficient retained earnings. 1.6500 Fed Ex Corp. outstanding bonds as of 05/31/21 Face amounts are in millions. Name Maturity Year Current Price Coupon % Weight Weighted YTM % 2034 Senior Secured Debt Senior Unsecured Debt Senior Unsecured Debt Senior Unsecured Debt Senior Unsecured Debt Senior Unsecured Debt Senior Unsecured Debt Senior Unsecured Debt Senior Unsecured Debt Senior Unsecured Debt Senior Unseoured Debt Senior Unsecured Debt Senior Unsecured Debt Senior Unsecured Debt Senior Unsecured Debt Senior Unsecured Debt Senior Unsecured Debt Senior Unsecured Debt Senior Unsecured Debt Senior Unsecured Debt (Foreign) Senior Unsecured Debt (Foreign) Senior Unsecured Debt (Foreign) Senior Unseoured Debt (Foreign) Senior Unsecured Debt (Foreign) Other Debt and Capital Leases Totals 2026 2028 2029 2030 2031 2034 2035 2041 2043 2044 2045 2046 2047 2048 2049 2050 2065 2098 2026 2027 2029 2032 2033 various Face Amount $(Mil) 930.00 810.00 555.00 395.00 1,740.00 985.00 505.00 580.00 740.00 1,215.00 795.00 820.00 2,955.00 930.00 1,345.00 835.00 1,230.00 325.00 225.00 615.00 1,510.00 725.00 600.00 790.00 525.00 22,680.00 or 22.680 billion 100.215 92.100 89.370 100.506 99.598 100.406 98.218 85.172 99.865 81.070 93.333 78.171 83.283 79.140 73.309 100.120 99.675 75.692 105.333 98.699 100.397 100.000 100.667 99.241 100.000 1.875% 3.2507 3.4007 4.2007 3.6507 2.400% 4.900% 3.900% 3.250% 4.000% 5.100% 4.100% 4.650% 4.400% 4.0507 4.9507 5.2507 4.5007 7.600% 0.450% 1.625% 0.4507 1.3007 0.950% 2.2007 Yield to Market Value Maturity % $ (Mil) 1.8575% 931.987 4.7605% 747.420 5.01537 497.093 4.1322% 396.979 3.6978% 1,733.145 2.3581% 988.962 5.0782% 496.135 5.3440% 495.056 3.2588% 739.023 5.4509% 986.999 5.6076% 742.468 5.7547% 642.432 5.91512 2,464.837 5.9614%. 737.429 6.0339% 988.512 4.9419% 836.030 5.2713% 1,226.086 6.0852% 246.271 7.2131% 237.015 0.6686% 607. 119 1.5655% 1,515.913 0.4500% 725.000 1.2404% 603.967 1.01217 784.055 2.1998% 525.011 20894.942 or 20.895 billion 0.0446 0.0358 0.0238 0.0190 0.0829 0.0473 0.0237 0.0237 0.0354 0.0472 0.0355 0.0307 0.1180 0.0353 0.0473 0.0400 0.0587 0.0118 0.0113 0.0291 0.0725 0.0347 0.0289 0.0375 0.0251 1.0000 0.08297 0.17032 0.11937 0.0785% 0.3067% 0.11162 0.1206% 0.1266% 0.11537 0.2575%. 0.1993% 0.17697 0.6978% 0.21042 0.2855% 0.1977% 0.3093% 0.0717% 0.0818% 0.0194% 0.1136% 0.0156% 0.0359% 0.03807 0.0553% 3.9973% Pre-tax Cost of Debt 3.9973% Adjustment for tax rate 0.7900 After tax Cost of Debt 3.1579% Excel Case #2 - Federal Express Corp. Answer Schedule Format Points available Remarks 0.50 1.75 0.50 0.50 0.50 use 05/31/21 data provided on Data tab-use value in BILLION use dividend growth for most recent six years as I have segreg use 05/31/21 data provided on Data tab use the most recent year on the Data tab use 05/31/21 data provided on Data tab Market value of equity (market cap) Growth rate for equity Market price of stock (per share) Annual dividend Beta of stock Risk free rate Market rate of return DGM cost of equity (stock) CAPM cost of equity (stock) Average cost of equity Market value of debt $83.110 billion currency, 3 decimal places 11.05% percentage, 2 decimal places $314.81 currency, 2 decimal places $2.70 currency, 2 decimal places 1.30 number, 2 decimal places 1.20% percentage, 2 decimal places 10.30% percentage, 2 decimal places 12.00% percentage, 2 decimal places 13.03% percentage, 2 decimal places 12.52% percentage, 2 decimal places billion currency, 3 decimal places 1.25 1.25 1.00 0.50 simple average of two methods use bond schedule for 05/31/21 - use value in BILLIONS use average for most recent six calendar years = there are two acceptable ways to calculate this that result in two slightly different answers use bond schedule for 05/31/21 - use value in BILLIONS use bond schedule for 05/31/21 - use value in BILLIONS use value in BILLIONS Average tax rate Pre tax cost of debt (bonds) After tax cost of debt (bonds) Total market value of equity and debt Weight for equity Weight for debt Weighted average cost of capital billion percentage, 2 decimal places percentage, 2 decimal places percentage, 2 decimal places currency, 3 decimal places number, 4 decimal places number, 4 decimal places percentage, 2 decimal places 1.00 3.50 1.25 0.50 1.25 1.25 3.50 2021-05 2020-05 2019-05 2018-05 2017-05 2016-05 7,087 12,069 587 Fed Ex Corp (FDX) BALANCE SHEET Fiscal year ends in May. USD in millions. Assets Current assets Cash and cash equivalents Receivables Inventories Prepaid expenses Total current assets Non-current assets - Gross property, plant and equipment Accumulated Depreciation Goodwill Intangible assets Other long-term assets Total non-current assets Total assets 4,881 10,102 572 828 16,383 2,319 9,116 553 1,098 13,086 3,265 8,481 525 1,070 13,341 3,969 7,599 514 546 12,628 3,534 7,252 496 707 11,989 837 20,580 70,077 (34,325) 6,992 15,383 4,070 62,197 82,777 65,024 (31,416) 6,372 13,917 3,257 57,154 73,537 59,511 (29,082) 6,884 600 3,404 41,317 54,403 55,121 (26,967) 6,973 480 3,382 50,626 (24,645) 7,154 529 2,260 35,924 48,552 47,018 (22,734) 6,747 1,008 2,036 34,075 46,064 38,989 52,330 146 3,841 7,465 2,208 13,660 51 3,269 5,101 1,923 10,344 964 3,030 3,634 1,385 9,013 1,342 2,977 4,375 933 9,627 22 2,752 4,363 781 7,918 29 2,944 4,231 804 8,008 Liabilities Current liabilities Short-term debt Accounts payable Accrued liabilities Other current liabilities Total current liabilities Non-current liabilities Long-term debt Deferred taxes liabilities Accrued liabilities Pensions and other benefits Other long-term liabilities Total non-current liabilities Total liabilities 20,879 total debt, this should match the number you get on the Bond Sched, cell G31 20,733 3,927 15,805 3,501 983 44,949 58,609 21,952 3,162 14,299 5,019 466 44,898 55,242 16,617 2,821 1,998 5,095 1,102 27,633 36,646 15,243 2,867 1,905 2,187 1,085 23,287 32,914 14,909 2,485 1,631 4,487 1,049 24,561 32,479 13,838 1,567 1,469 6,227 1,171 24,272 32,280 Stockholders' equity Ex Corp. yahoo finance data 05/31/21 year end) Annual Annual Dividends Growth Rates 2.7000 0.1020 Average Growth Rate 0.1036 2.4500 0.0889 Current stock price Market Cap (value) Beta PE Ratio EPS Annual dividend # of shares outstanding $ 314.81 $ 83.110 billion 1.30 15.91 $ 19.79 $ 2.70 264 million 2.2500 0.0976 Quarterly Dividends 0.7500 0.6500 0.6500 0.6500 0.6500 0.6000 0.6000 0.6000 0.6000 0.5500 0.5500 0.5500 0.5500 0.5000 0.5000 0.5000 0.5000 0.4500 0.4500 0.4500 0.4500 0.4000 0.4000 0.4000 current price outstanding shares market value Date 06/25/21 03/05/21 12/11/20 09/03/20 06/26/20 03/06/20 12/06/19 09/06/19 06/21/19 03/08/19 12/07/18 09/07/18 06/22/18 03/09/18 12/08/17 09/08/17 06/20/17 03/09/17 12/08/16 09/08/16 06/14/16 03/10/16 12/10/15 09/08/15 2.0500 $ 314.81 264,000,000 $ 83,109,840,000 or $ 83.110 billion 0.1081 1.8500 0.1212 Note: FedEx paid out more in dividends in the most recent year end than it actually earned. Companies can do this if they have sufficient retained earnings. 1.6500 Fed Ex Corp. outstanding bonds as of 05/31/21 Face amounts are in millions. Name Maturity Year Current Price Coupon % Weight Weighted YTM % 2034 Senior Secured Debt Senior Unsecured Debt Senior Unsecured Debt Senior Unsecured Debt Senior Unsecured Debt Senior Unsecured Debt Senior Unsecured Debt Senior Unsecured Debt Senior Unsecured Debt Senior Unsecured Debt Senior Unseoured Debt Senior Unsecured Debt Senior Unsecured Debt Senior Unsecured Debt Senior Unsecured Debt Senior Unsecured Debt Senior Unsecured Debt Senior Unsecured Debt Senior Unsecured Debt Senior Unsecured Debt (Foreign) Senior Unsecured Debt (Foreign) Senior Unsecured Debt (Foreign) Senior Unseoured Debt (Foreign) Senior Unsecured Debt (Foreign) Other Debt and Capital Leases Totals 2026 2028 2029 2030 2031 2034 2035 2041 2043 2044 2045 2046 2047 2048 2049 2050 2065 2098 2026 2027 2029 2032 2033 various Face Amount $(Mil) 930.00 810.00 555.00 395.00 1,740.00 985.00 505.00 580.00 740.00 1,215.00 795.00 820.00 2,955.00 930.00 1,345.00 835.00 1,230.00 325.00 225.00 615.00 1,510.00 725.00 600.00 790.00 525.00 22,680.00 or 22.680 billion 100.215 92.100 89.370 100.506 99.598 100.406 98.218 85.172 99.865 81.070 93.333 78.171 83.283 79.140 73.309 100.120 99.675 75.692 105.333 98.699 100.397 100.000 100.667 99.241 100.000 1.875% 3.2507 3.4007 4.2007 3.6507 2.400% 4.900% 3.900% 3.250% 4.000% 5.100% 4.100% 4.650% 4.400% 4.0507 4.9507 5.2507 4.5007 7.600% 0.450% 1.625% 0.4507 1.3007 0.950% 2.2007 Yield to Market Value Maturity % $ (Mil) 1.8575% 931.987 4.7605% 747.420 5.01537 497.093 4.1322% 396.979 3.6978% 1,733.145 2.3581% 988.962 5.0782% 496.135 5.3440% 495.056 3.2588% 739.023 5.4509% 986.999 5.6076% 742.468 5.7547% 642.432 5.91512 2,464.837 5.9614%. 737.429 6.0339% 988.512 4.9419% 836.030 5.2713% 1,226.086 6.0852% 246.271 7.2131% 237.015 0.6686% 607. 119 1.5655% 1,515.913 0.4500% 725.000 1.2404% 603.967 1.01217 784.055 2.1998% 525.011 20894.942 or 20.895 billion 0.0446 0.0358 0.0238 0.0190 0.0829 0.0473 0.0237 0.0237 0.0354 0.0472 0.0355 0.0307 0.1180 0.0353 0.0473 0.0400 0.0587 0.0118 0.0113 0.0291 0.0725 0.0347 0.0289 0.0375 0.0251 1.0000 0.08297 0.17032 0.11937 0.0785% 0.3067% 0.11162 0.1206% 0.1266% 0.11537 0.2575%. 0.1993% 0.17697 0.6978% 0.21042 0.2855% 0.1977% 0.3093% 0.0717% 0.0818% 0.0194% 0.1136% 0.0156% 0.0359% 0.03807 0.0553% 3.9973% Pre-tax Cost of Debt 3.9973% Adjustment for tax rate 0.7900 After tax Cost of Debt 3.1579%
Step by Step Solution
There are 3 Steps involved in it
Step: 1

Get Instant Access to Expert-Tailored Solutions
See step-by-step solutions with expert insights and AI powered tools for academic success
Step: 2

Step: 3
Ace Your Homework with AI
Get the answers you need in no time with our AI-driven, step-by-step assistance
Get Started
Handbook Of High Frequency Trading
Authors: Greg N. Gregoriou
1st Edition
0128022051, 978-0128022054