Answered step by step
Verified Expert Solution
Link Copied!

Question

1 Approved Answer

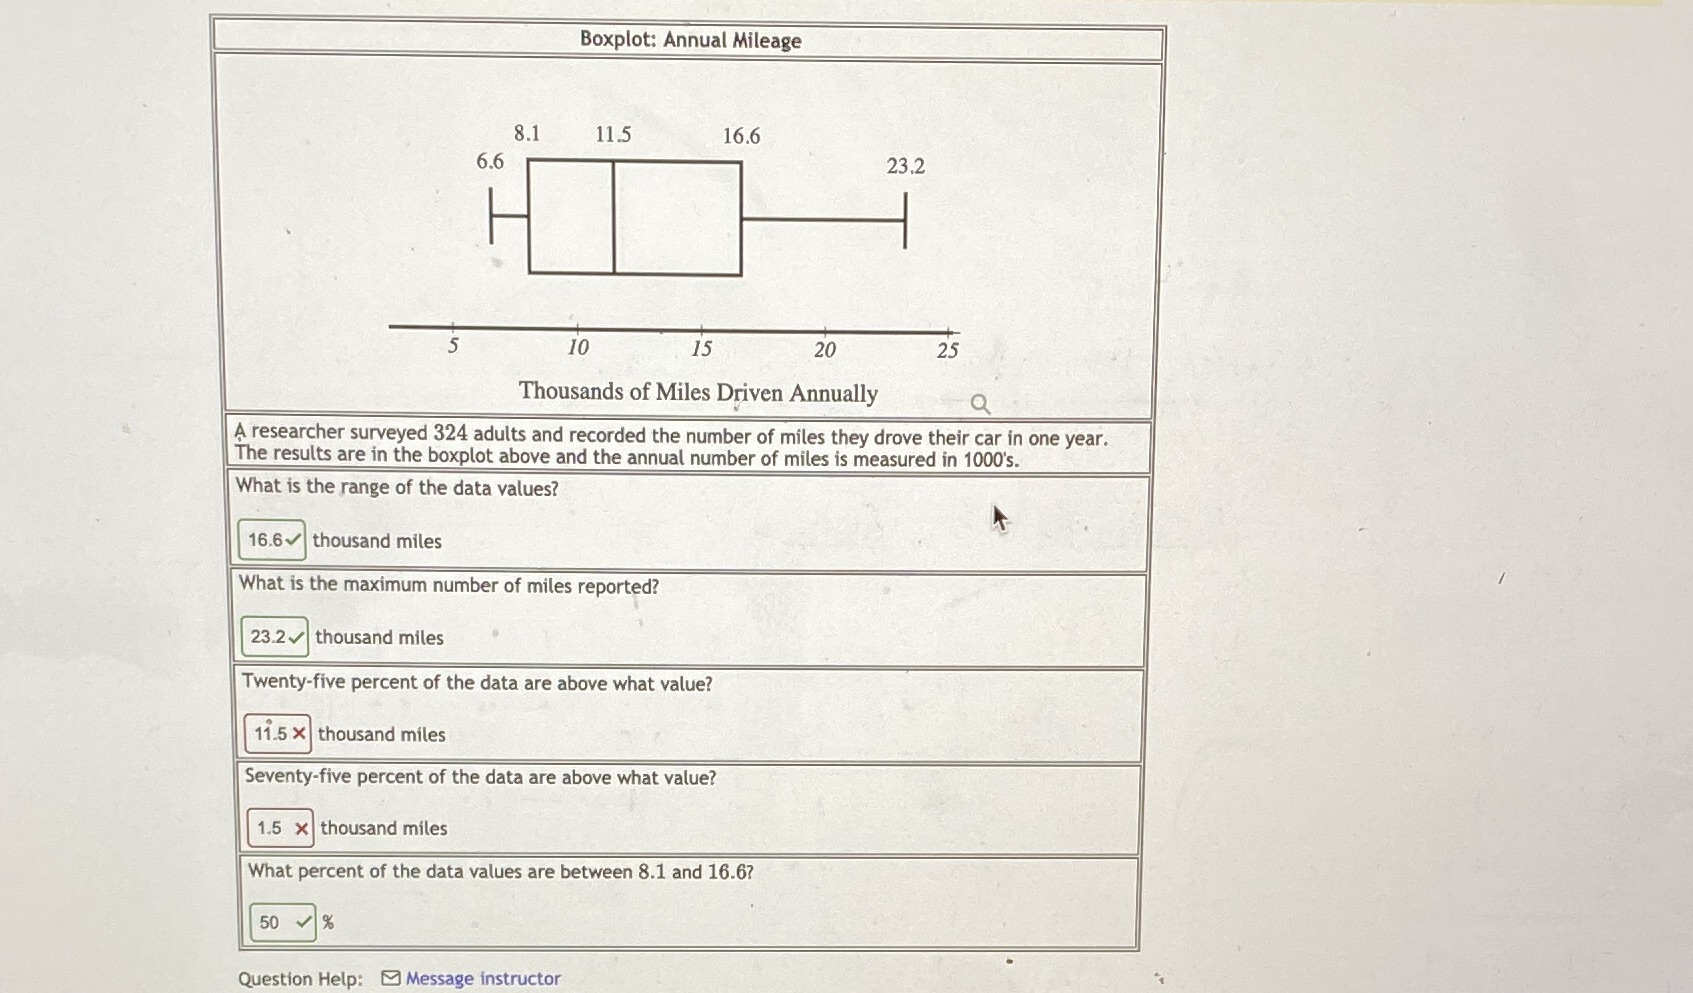
need help on the two i got wrong Boxplot: Annual Mileage 8.1 11.5 16.6 6.6 23.2 5 10 15 20 25 Thousands of Miles Driven

need help on the two i got wrong

image text in transcribed
Boxplot: Annual Mileage 8.1 11.5 16.6 6.6 23.2 5 10 15 20 25 Thousands of Miles Driven Annually A researcher surveyed 324 adults and recorded the number of miles they drove their car in one year. The results are in the boxplot above and the annual number of miles is measured in 1000's. What is the range of the data values? 16.6 thousand miles What is the maximum number of miles reported? 23.2 thousand miles Twenty-five percent of the data are above what value? 11.5 x thousand miles Seventy-five percent of the data are above what value? 1.5 x thousand miles What percent of the data values are between 8.1 and 16.67 50 Question Help: Message instructor

Step by Step Solution

There are 3 Steps involved in it

Step: 1

blur-text-image

Get Instant Access to Expert-Tailored Solutions

See step-by-step solutions with expert insights and AI powered tools for academic success

Step: 2

blur-text-image

Step: 3

blur-text-image

Ace Your Homework with AI

Get the answers you need in no time with our AI-driven, step-by-step assistance

Get Started

Recommended Textbook for

Linear Algebra With Applications

Authors: Jeffrey Holt

2nd Edition

1319057691, 9781319057695

More Books

Students also viewed these Mathematics questions

Question

What is buzz? How can marketers create it?

Answered: 1 week ago