Need help please
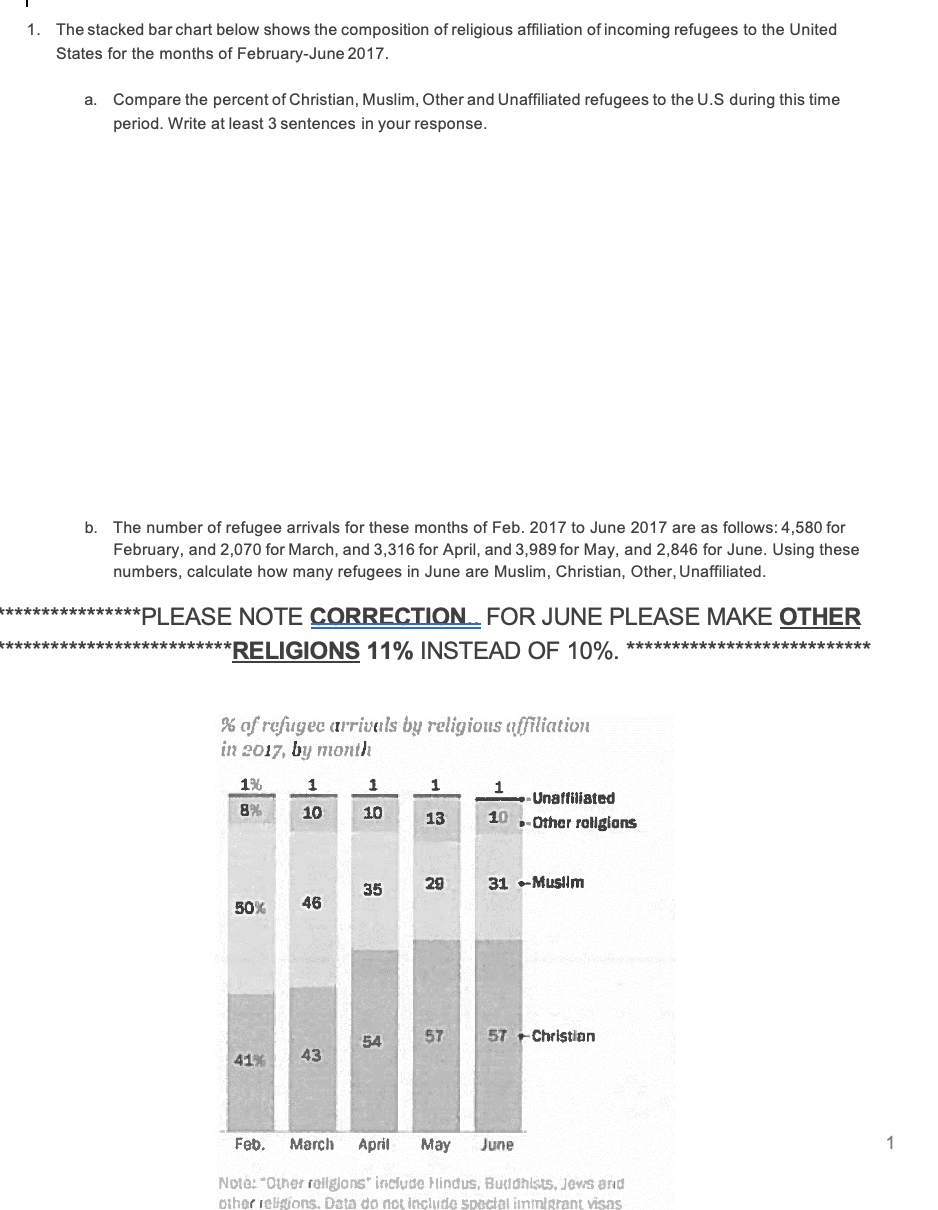
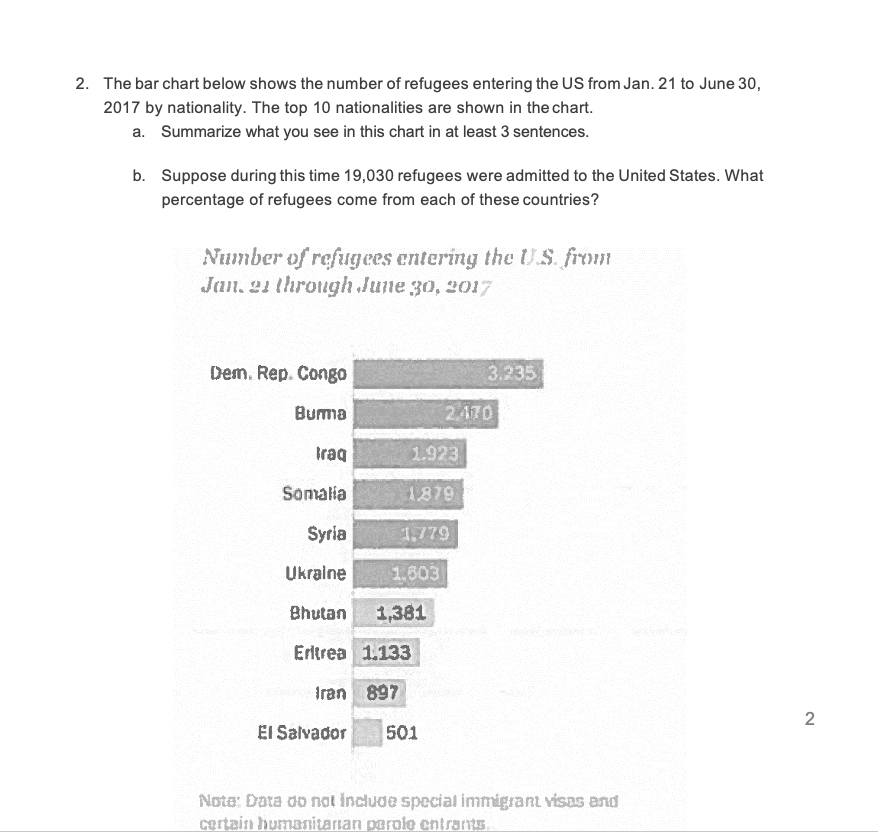
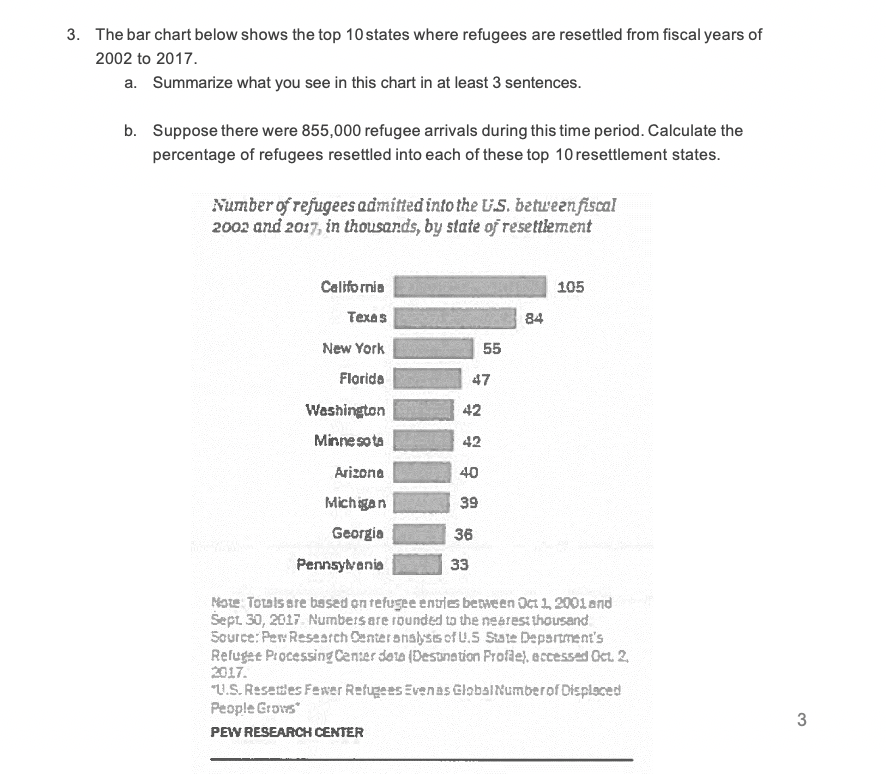
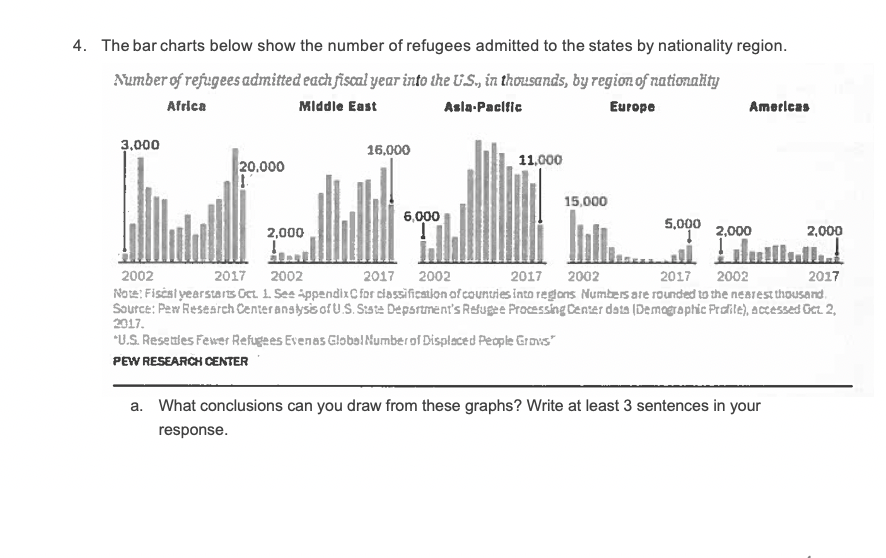
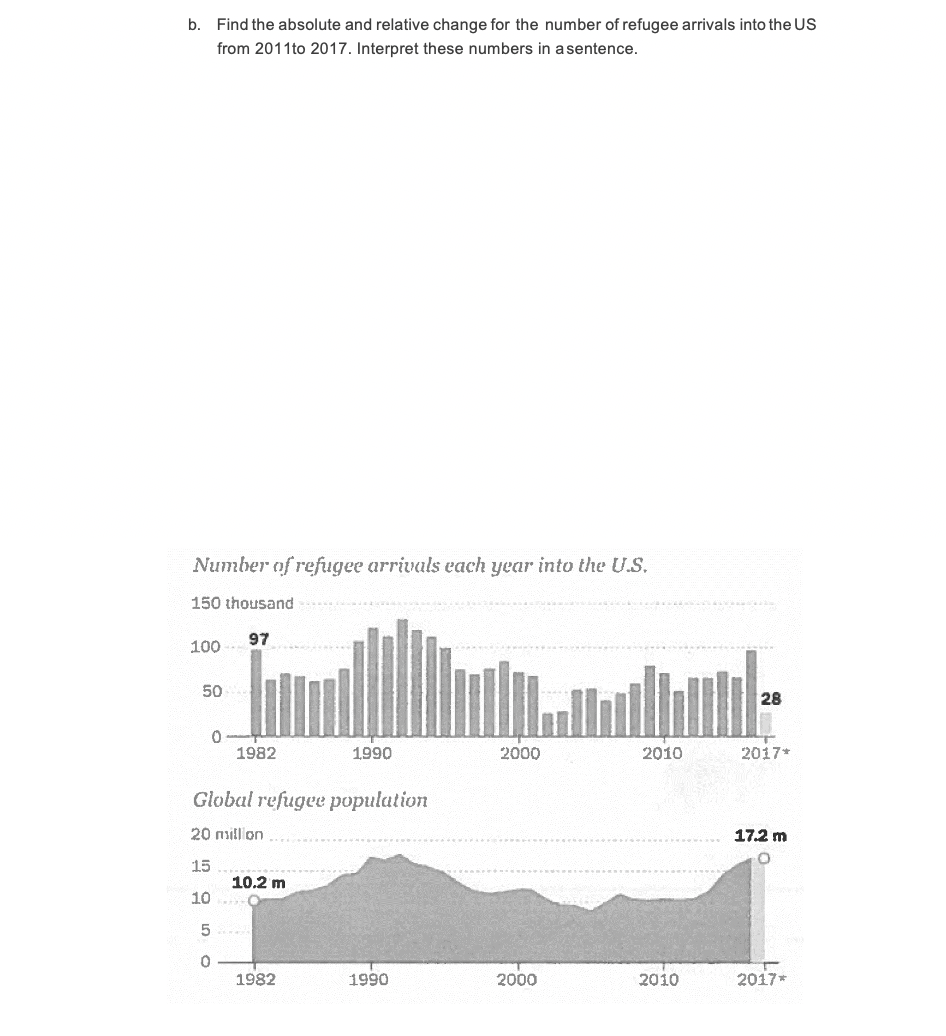
1. The stacked bar chart below shows the composition of religious affiliation of incoming refugees to the United States for the months of February-June 2017. a. Compare the percent of Christian, Muslim, Other and Unaffiliated refugees to the U.S during this time period. Write at least 3 sentences in your response. b. The number of refugee arrivals for these months of Feb. 2017 to June 2017 are as follows: 4,580 for February, and 2,070 for March, and 3,316 for April, and 3,989 for May, and 2,846 for June. Using these numbers, calculate how many refugees in June are Muslim, Christian, Other, Unaffiliated. ***************PLEASE NOTE CORRECTION . FOR JUNE PLEASE MAKE OTHER *************************RELIGIONS 11% INSTEAD OF 10%. *************************** % of refugee arrivals by religious affiliation in 2017, by month 136 8%% 10 10 -Unaffiliated 10 -Other religions 35 29 31 --Muslim 50 46 54 57 57 -Christian 41% 43 Feb. March April May June Note: "Other railglans" include Hindus, Buddhists, Jews and other religions. Data do not include special immigrant visas. The bar chart below shows the number of refugees entering the US from Jan. 21 to June 30. 2017 by nationality. The top 10 nationalities are shown in the chart. a. Summarize what you see in this chart in at least 3 sentences. I). Suppose during this time 19.030 refugees were admitted to the United States. What percentage of refugees come from each of these countries? Munber of rqrgrres entering the I. 3.3. fnmr Jun. 2: through June 30, 201;; Note: Data no nol Induce special Immigrant m mu certain llummritanan parole entrants 3. The bar chart below shows the top 10 states where refugees are resettled from fiscal years of 2002 to 2017. a. Summarize what you see in this chart in at least 3 sentences. b. Suppose there were 855,000 refugee arrivals during this time period. Calculate the percentage of refugees resettled into each of these top 10 resettlement states. Number of refugees admitted into the U.S. betweenfiscal 2002 and 2017, in thousands, by state of resettlement California 105 Texas 84 New York 55 Florida 47 Washington 42 Minnesota 42 Arizona 40 Michigan 39 Georgia 36 Pennsylvania 33 Note: Totals are based on refugee entries between Oct 1, 2001 and Sept. 30, 2017. Numbers are rounded to the nearest thousand Source: Pew Research Center analysis of U.S State Department's Refugee Processing Center data (Destination Profile), accessed Oct 2, 2017. "U.S. Resettles Fewer Refugees Evenas Global Numberof Displaced People Grows* PEW RESEARCH CENTER 34. The bar charts below show the number of refugees admitted to the states by nationality region. Number of refugees admitted each fiscal year into the U.S., in thousands, by region of nationality Africa Middle East Asia Pacific Europe Americas 3.000 16,000 20.000 11,000 15,000 2,000 5,000 2,000 2,000 An 2002 2017 2002 2017 2002 2017 2002 2017 2002 2017 Note: Fiscal yearstarts Oct 1. See Appendix C for classification of countries into regions Numbers are rounded to the nearest thousand Source: Pew Research Center analysis of U.S. State Department's Refugee Processing Center data (Demographic Profile), accessed Oct 2, 2017. *U.S. Resetles Fewer Refugees Evenas Global Number of Displaced People Grows" PEW RESEARCH CENTER a. What conclusions can you draw from these graphs? Write at least 3 sentences in your response.[1. Calculate the absolute change and relative change for refugees admitted to the US from Africa. Interpret these values in asentence. 5. Summarize what you see in the prior graph (number of refugees each scal year admitted into the US by region of nationality} and summarize what you see in the below graphs {Number of refugee arrivals each year into the USJGIobaI refugee population}. a. What do the three graphs tog ether convey? Write your answer in at least 3 sentences. b. Find the absolute and relative change for the number of refugee arrivals into the US from 2011to 2017. Interpret these numbers in a sentence. Number of refugee arrivals each year into the U.S. 150 thousand 100 97 50 28 1982 1990 2000 2010 2017* Global refugee population 20 million 17.2 m 15 10.2 m 10 5 O 1982 1990 2000 2010 2017*
