Answered step by step
Verified Expert Solution
Question
1 Approved Answer
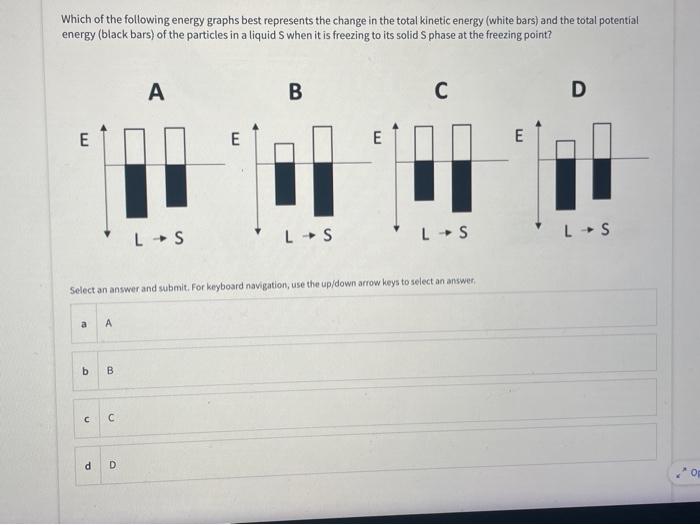
need help plz Which of the following energy graphs best represents the change in the total kinetic energy (white bars) and the total potential energy
need help plz 
Which of the following energy graphs best represents the change in the total kinetic energy (white bars) and the total potential energy (black bars) of the particles in a liquid S when it is freezing to its solid S phase at the freezing point 
Step by Step Solution
There are 3 Steps involved in it
Step: 1

Get Instant Access to Expert-Tailored Solutions
See step-by-step solutions with expert insights and AI powered tools for academic success
Step: 2

Step: 3

Ace Your Homework with AI
Get the answers you need in no time with our AI-driven, step-by-step assistance
Get Started


