Answered step by step
Verified Expert Solution
Link Copied!

Question

1 Approved Answer

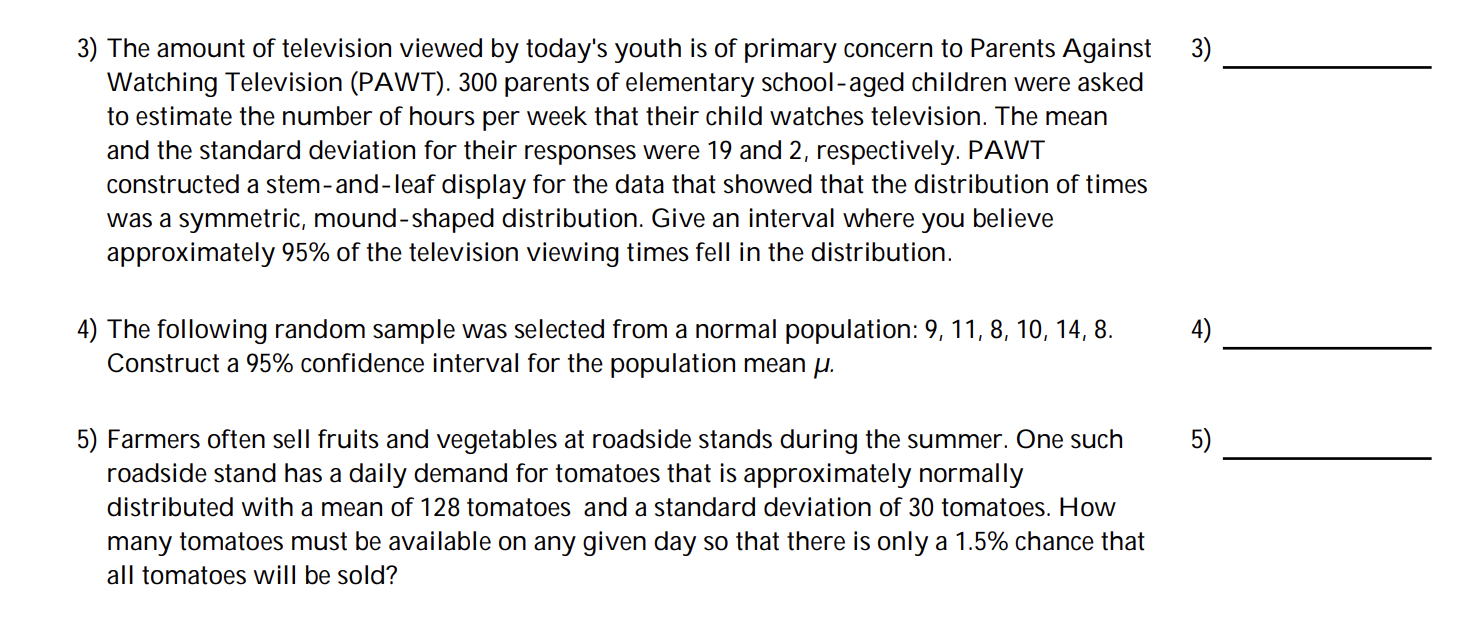
Need help thank you 3) The amount of television viewed by today's youth is of primary concern to Parents Against Watching Television (PAWT). 300 parents

Need help thank you

image text in transcribedimage text in transcribed
3) The amount of television viewed by today's youth is of primary concern to Parents Against Watching Television (PAWT). 300 parents of elementary school-aged children were asked to estimate the number of hours per week that their child watches television. The mean and the standard deviation for their responses were 19 and 2, respectively. PAWT constructed a stem-and- leaf display for the data that showed that the distribution of times was a symmetric, mound-shaped distribution. Give an interval where you believe approximately 95% of the television viewing times fell in the distribution. 4) The following random sample was selected from a normal population: 9, 11, 8, 10, 14, 8. Construct a 95% confidence interval for the population mean p. 5) Farmers often sell fruits and vegetables at roadside stands during the summer. One such roadside stand has a daily demand for tomatoes that is approximately normally distributed with a mean of 128 tomatoes and a standard deviation of 30 tomatoes. How many tomatoes must be available on any given day so that there is only a 1.5% chance that all tomatoes will be sold? 3) 4) 5) Solve the problem. 1) The following data represent the scores of 50 students on a statistics exam. The mean score 1) is 80.02, and the standard deviation is 11.9. 39 51 59 63 66 68 68 69 70 71 71 71 73 74 76 76 76 77 78 79 79 79 79 80 80 82 83 83 83 85 85 86 86 88 88 88 88 89 89 89 90 90 91 91 92 95 96 97 97 98 What percentage of the scores lies within one standard deviation of the mean? two standard deviations of the mean? three standard deviations of the mean? Based on these percentages, do you believe that the distribution of scores is mound-shaped and symmetric? Explain. 2) The data below show the types of medals won by athletes representing the United States in 2) the Winter Olympics. gold gold silver gold bronze silver silver bronze gold silver silver bronze silver gold gold silver silver bronze bronze gold silver gold gold bronze bronze a. Construct a frequency table for the data. b. Construct a relative frequency table for the data. c. Construct a frequency bar graph for the data

Step by Step Solution

There are 3 Steps involved in it

Step: 1

blur-text-image

Get Instant Access to Expert-Tailored Solutions

See step-by-step solutions with expert insights and AI powered tools for academic success

Step: 2

blur-text-image

Step: 3

blur-text-image

Ace Your Homework with AI

Get the answers you need in no time with our AI-driven, step-by-step assistance

Get Started

Recommended Textbook for

Algebra And Trigonometry

Authors: Cynthia Y Young

5th Edition

1119820898, 9781119820895

More Books

Students also viewed these Mathematics questions