Answered step by step
Verified Expert Solution
Question
1 Approved Answer
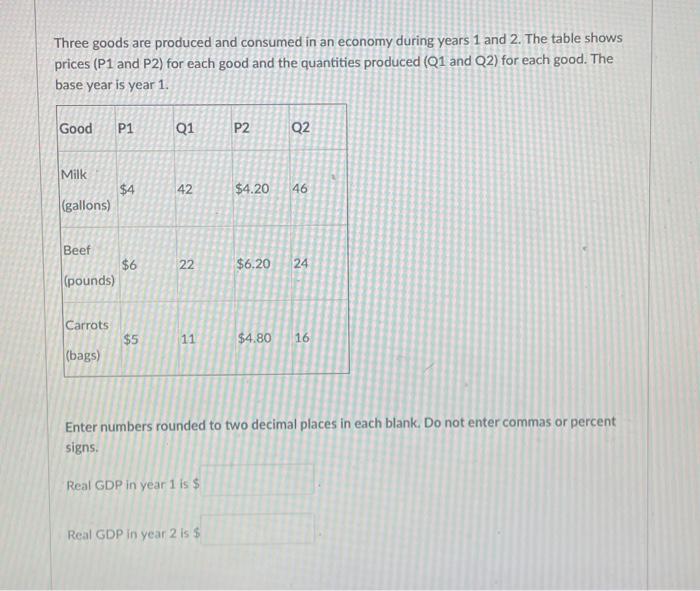
need help Three goods are produced and consumed in an economy during years 1 and 2. The table shows prices (P1 and P2) for each
need help 
Three goods are produced and consumed in an economy during years 1 and 2. The table shows prices (P1 and P2) for each good and the quantities produced (Q1 and Q2) for each good. The base year is year 1. Good P1 Q1 P2 Q2 Milk $4 42 $4.20 46 (gallons) Beef $6 (pounds) 22 $6.20 24 Carrots $5 11 $4.80 16 (bags) Enter numbers rounded to two decimal places in each blank. Do not enter commas or percent signs. Real GDP in year 1 is $ Real GDP in year 2 is $ 
Step by Step Solution
There are 3 Steps involved in it
Step: 1

Get Instant Access to Expert-Tailored Solutions
See step-by-step solutions with expert insights and AI powered tools for academic success
Step: 2

Step: 3

Ace Your Homework with AI
Get the answers you need in no time with our AI-driven, step-by-step assistance
Get Started


