Answered step by step
Verified Expert Solution
Link Copied!

Question

1 Approved Answer

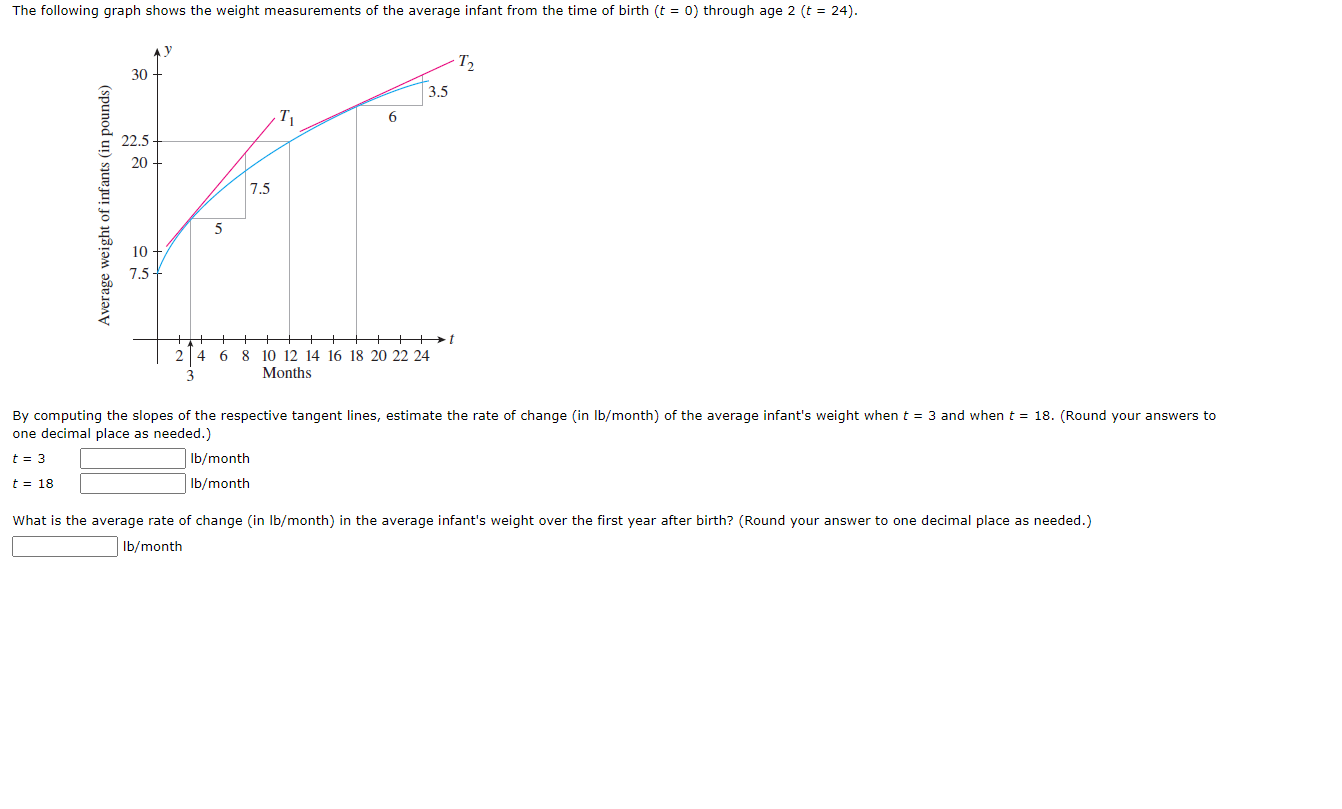
need help to solve. please see attached The following graph shows the weight measurements of the average infant from the time of birth (t =

need help to solve. please see attached

image text in transcribed
The following graph shows the weight measurements of the average infant from the time of birth (t = 0) through age 2 (t = 24). 30 12 3.5 11 6 22.5 20 7.5 Average weight of infants (in pounds) 5 7.5 - 2 4 6 8 10 12 14 16 18 20 22 24 Months By computing the slopes of the respective tangent lines, estimate the rate of change (in lb/month) of the average infant's weight when t = 3 and when t = 18. (Round your answers to one decimal place as needed.) t = 3 Ib/month t = 18 Ib/month What is the average rate of change (in lb/month) in the average infant's weight over the first year after birth? (Round your answer to one decimal place as needed.) Ib/month

Step by Step Solution

There are 3 Steps involved in it

Step: 1

blur-text-image

Get Instant Access to Expert-Tailored Solutions

See step-by-step solutions with expert insights and AI powered tools for academic success

Step: 2

blur-text-image

Step: 3

blur-text-image

Ace Your Homework with AI

Get the answers you need in no time with our AI-driven, step-by-step assistance

Get Started

Recommended Textbook for

Basic Mathematics With Early Integers

Authors: Charles P McKeague

1st Edition

1936368978, 9781936368976

More Books

Students also viewed these Mathematics questions