

Question
Need help understanding assignment, its been years since i have done any of this and have no idea what to do. Please help, just looking
Need help understanding assignment, its been years since i have done any of this and have no idea what to do. Please help, just looking for guidance. Even links that i can try a descriptive statistics analyses with Excel
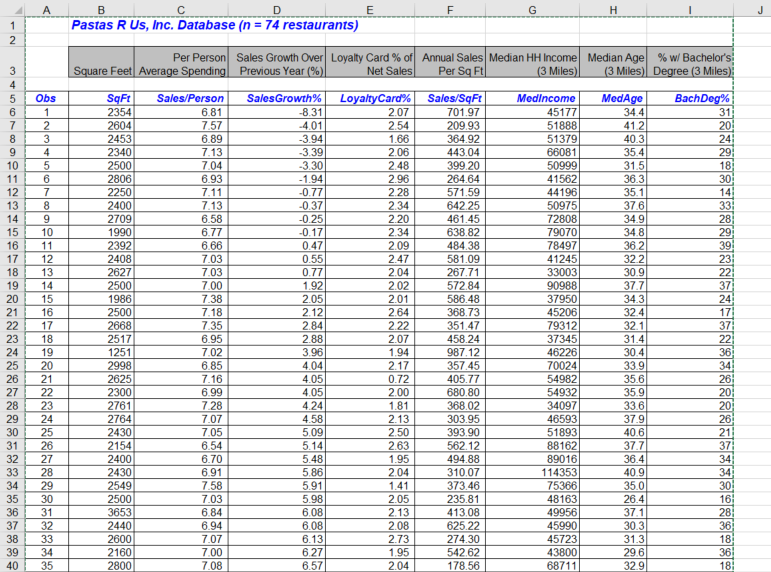
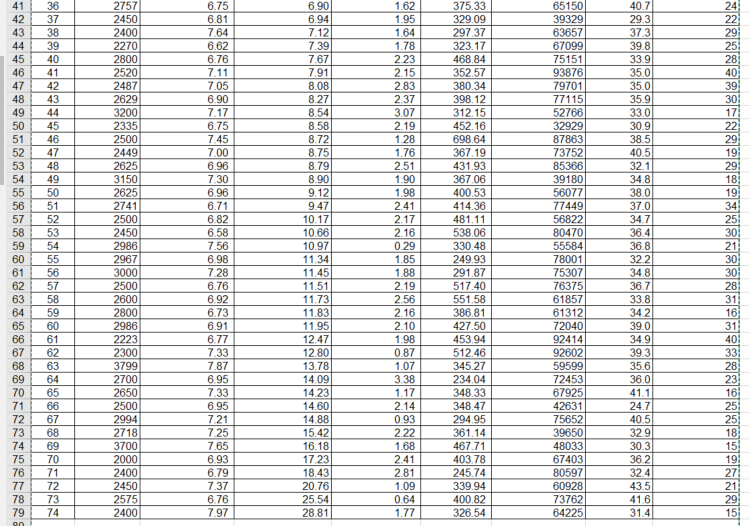
- Insert a new column in the database that corresponds to "Annual Sales." Annual Sales is the result of multiplying a restaurant's "SqFt." by "Sales/SqFt."
- Calculate the mean, standard deviation, skew, 5-number summary, and interquartile range (IQR) for each of the variables.
- make a box-plot for the "Annual Sales" variable.
- make a histogram for the "Sales/SqFt" variable.
Step by Step Solution
There are 3 Steps involved in it
Step: 1

Get Instant Access to Expert-Tailored Solutions
See step-by-step solutions with expert insights and AI powered tools for academic success
Step: 2

Step: 3
Ace Your Homework with AI
Get the answers you need in no time with our AI-driven, step-by-step assistance
Get Started
An Introduction to Analysis
Authors: William R. Wade
4th edition
132296381, 978-0132296380