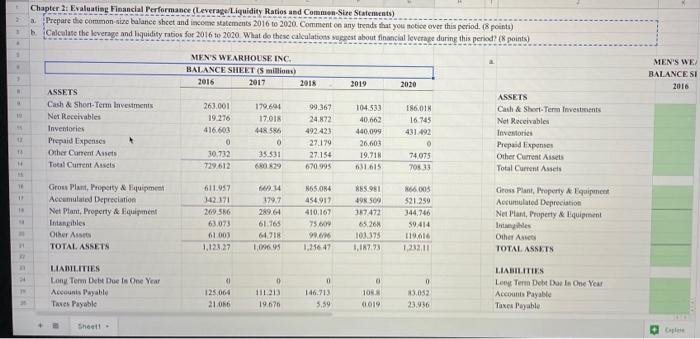
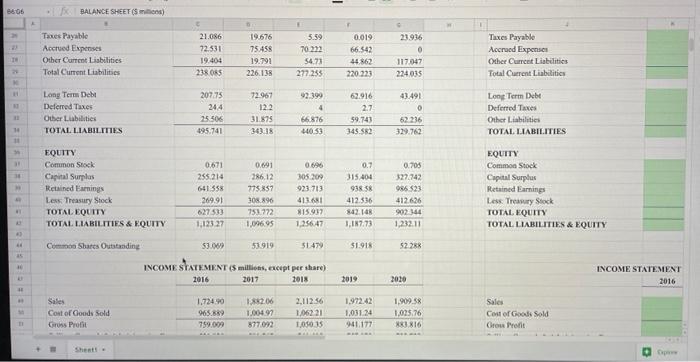
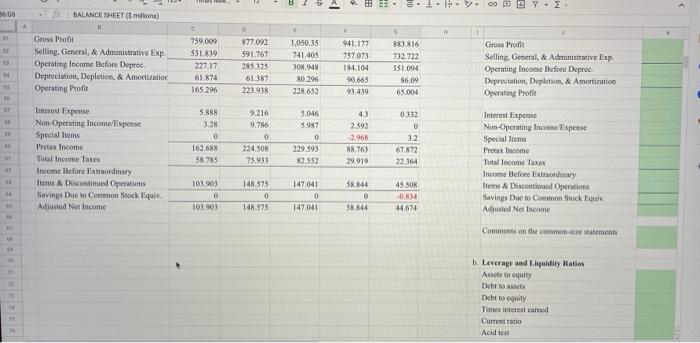
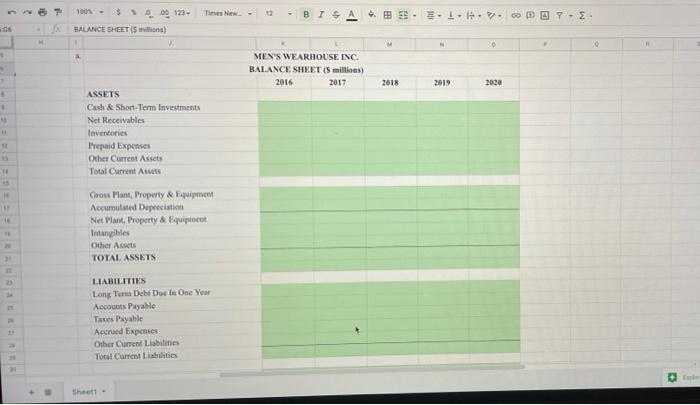
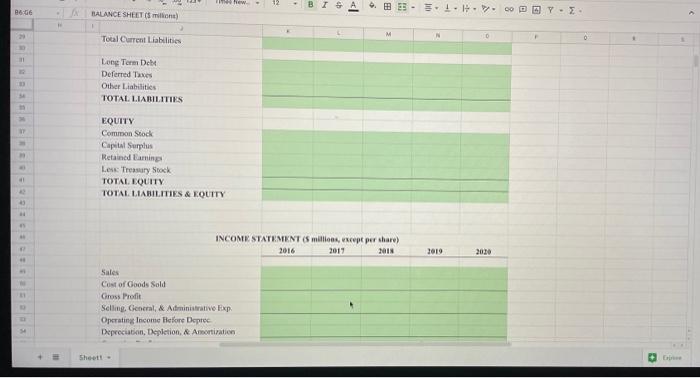
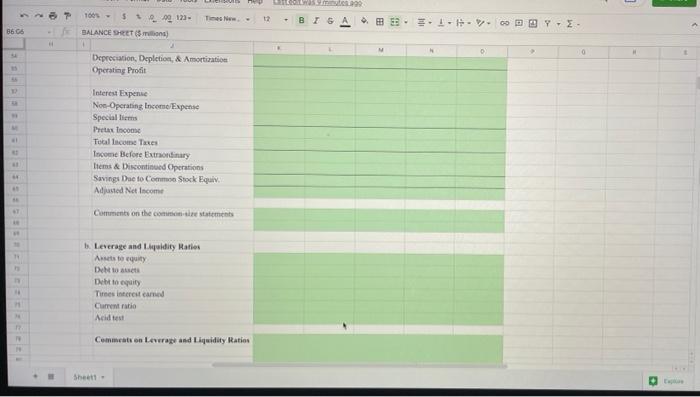
*Need help what's highlighted in GREEN*
**PLEASE SHOW WORK**
2 Chapter 3: Evaluating Financial Performance (Leverage Liquidity Ratios and Common-Sire Statements) a. Prepare the common si balance sheet and income statements 2016 to 2020. Comment on any trends that you notice over this period. 1 points) Calculate the leverage and liquidity ratios for 2016 to 2020 What do these calculations vuggest about financial leverage during this period? (8 points) 1 MEN'S WEARHOUSE INC. BALANCE SHEET (5 millions) 2016 2017 2018 MEN'S WE BALANCE SI 2016 2019 2020 104.533 1 0.663 ASSETS Cash & Short-Term Investments Not Receivables Inventories Prepaid Expenses Other Current Assets Total Current Assets 263.001 19.276 416,603 0 30,732 729 612 179.694 17.018 44855 0 35.331 UT 13 99.367 24.872 492.425 27.179 27.154 670 995 440.099 26,603 19.718 31.615 ASSETS Cash & Short Term Investments Not Receivables Investors Prepaid Expenses Other Current Assets Total Current Assets 186018 16745 431 492 0 74075 705 33 1 1 Grous Plant Property & quipment Accumulated Depreciation Net Plant Property & Equipment Intangibles Other Asses TOTAL ASSETS 611.957 342371 260 586 63.073 61.003 1.121.27 6.14 1797 289.64 61.765 64718 1,0693 165.084 454917 410,167 75.00 99.00 1.256-47 885.981 498 509 387472 65.26% 101375 1.17.73 66.005 521.259 344 746 59414 119.616 1.232.11 Gross Plant Property Equipment Accumulated Depreciation Net Plant Property & Equipment Intes Other Asco TOTAL ASSETS 4 0 0 LIABILITIES Long Term Debt Deels One Year Accounts Payable Taxes Payable 125.064 21.056 111213 19.070 0 146.213 5.59 0 105 001 LIABILITIES Long Term Debte In One Year Accounts Payale Taxes Table 23.052 23.936 Sheet a B606 BALANCE SHEET (3 min) Tanes Payable Accrued Expenses Other Current Liabilities Total Current Liabilities 21.086 72.531 19.404 238 ORS 19.676 75.458 19.791 226,138 5.59 70222 54.71 277.255 0.019 66.542 44862 220.223 23.936 0 117.047 224 015 Taxes Payable Accrued Expenses Other Current Liabilities Total Current Liabilities TE Long Term Debt Deferred Taxes Other Liabilities TOTAL LIABILITIES 20775 244 25 506 195.741 72.967 122 31.575 343:18 92.399 4 66.876 44653 62.916 2.7 59.743 345 582 43.491 o 62 236 329,762 Long Term Dube Deferred Taxes Other Liabilities TOTAL LIABILITIES 10 1 3 EQUITY Common Stock Capital Surplus Retained Earnings Les Treasury Stock TOTAL EQUITY TOTAL LIABILITIES & EQUITY 0.671 255.214 641.358 269.91 627533 1,123 27 0.691 286.12 775.857 308.896 751772 1,096.95 0.696 305 309 923-713 41361 815917 12256.47 0.7 315404 938 58 412.536 842.148 1.117.73 0.705 327.742 986 523 412626 902344 1,232.11 EQUITY Common Stock Capital Surplus Retained Earnings Less Treasury Stock TOTAL EQUITY TOTAL LIABILITIES & EQUITY 51.913 522% 35 Coco Share Outstanding 53.00 53.919 51479 INCOME STATEMENT (5 millions, except per share) 2016 2017 2018 2019 2020 INCOME STATEMENT 2016 11 Sales Cost of Goods Sold Grons Profit 1.724.90 965.839 759.009 1882.06 1.00497 877.092 2.11256 1.06221 1050 15 1972.42 1,031.24 941.177 1.909.58 1.025.76 XXI 816 Sales Cost of Good Sold Grou Pront a A 00 OBY- Go BALANCE SHEET (5 million) A 11 11 Gross Protot Selling, General, & Administrative Exp Operating Income Before Deprec Depreciation, Depletion. & Amortizatio Operating Profit 759,009 531.839 227.17 61.874 165 296 877.092 591.767 285 125 6137 223.988 1,050.35 741.405 308.948 80.296 228.652 941.177 757.673 181104 90.665 93.439 883816 732.722 151.094 86.09 65.004 Gross Profile Selling General, & Administrative Exp. Operating Income Before Deprec. Depreciation, Deption, & Amortiration Operating Prote 14 Interest Expense Non-Operating Income/Expense Special Hems Trytax Income Total Income Taxes Income before Extraordinary Items & Discontinued Operations Savings Dav to Common Stock Equiv. Adjusted Net Income 5.888 1.28 0 162.688 56789 9.216 9.786 0 224.508 75.933 5.046 5.987 0 229.593 82.552 43 2.592 296 88.763 29.019 0332 0 3.2 67.872 22,164 Interest Expense Non-Operating locore.Expense Special Rem Pretax Income Total Income Taxes Income before Extraordinary Item & Discontinued Operation Saving Due to Common Stock Ful Adjusted Net nome 103903 0 101.90 148.575 0 14.575 147.041 0 147041 58844 . 58844 45.SOR -0.834 44.64 Comments on the common.stre statements 1. Leverage and Liquidity Ratio Assets to quity Debt to asses Detto equily Tones interesteamed Current ratio Acides 7 Time- 12 BISA 4. - 1001 - $ 000123- BALANCE SHEET(5 milions) I... 60 DBY- . MEN'S WEARHOUSE INC. BALANCE SHEET (5 millions) 2016 2017 2018 2019 2020 ASSETS Cash & Short-Term Investments Net Receivables Inventories Prepaid Expenses Other Current Assets Total Current Assets Cross Plant Property Equipe Accumulated Dupreciation Net Plant, Property & Equipement Intangibles Other Assets TOTAL ASSETS 3 LIABILITIES Long Term Debt Dec Is One Year Accounts Payable Taxes Payable Accrued Expenses Other Current Liabilities Total Current Liabilities 1 Sheet - hew . BTA ..- .1... 00POY. 26.06 . BALANCE SHEET(Smiliona) 1 Total Current Liabilities M 29 0 11 Long Term Debt Deferred Taxes Other Liabilities TOTAL LIABILITIES EQUITY Common Stock Capital Surplus Retained Barings Les Treasury Stock TOTAL EQUITY TOTAL LIABILITIES & EQUITY 41 INCOME STATEMENT 5 millions, copper share) 2016 2013 2015 2019 2010 Sales Cost of Goods Sold Gross Profit Selling. General, & Administrative Exp Operating Income Refore Deprec Depreciation, Depletion. Amortization Sheett- 3 7 TN- 12 $0.99 123 BALANCE SHEETS) BIGA IV. 00 YE. B6 G6 . 0 Depreciation, Depletion, & Amortization Operating Profit Interest Expense Non-Operating Income Expense Specialis Pretax income Total Income Taxes Income Before Extraordinary Items & Discontinued Operations Savings Due to Common Stock Equiv. Adjusted Net Income Comments on the contestatements 1 Leverage and liquidity Ratio Arte equity De tout Dette equity Times interest earned Current ratio Acids Comment en leverage and Liquidity Ration Sheet E 2 Chapter 3: Evaluating Financial Performance (Leverage Liquidity Ratios and Common-Sire Statements) a. Prepare the common si balance sheet and income statements 2016 to 2020. Comment on any trends that you notice over this period. 1 points) Calculate the leverage and liquidity ratios for 2016 to 2020 What do these calculations vuggest about financial leverage during this period? (8 points) 1 MEN'S WEARHOUSE INC. BALANCE SHEET (5 millions) 2016 2017 2018 MEN'S WE BALANCE SI 2016 2019 2020 104.533 1 0.663 ASSETS Cash & Short-Term Investments Not Receivables Inventories Prepaid Expenses Other Current Assets Total Current Assets 263.001 19.276 416,603 0 30,732 729 612 179.694 17.018 44855 0 35.331 UT 13 99.367 24.872 492.425 27.179 27.154 670 995 440.099 26,603 19.718 31.615 ASSETS Cash & Short Term Investments Not Receivables Investors Prepaid Expenses Other Current Assets Total Current Assets 186018 16745 431 492 0 74075 705 33 1 1 Grous Plant Property & quipment Accumulated Depreciation Net Plant Property & Equipment Intangibles Other Asses TOTAL ASSETS 611.957 342371 260 586 63.073 61.003 1.121.27 6.14 1797 289.64 61.765 64718 1,0693 165.084 454917 410,167 75.00 99.00 1.256-47 885.981 498 509 387472 65.26% 101375 1.17.73 66.005 521.259 344 746 59414 119.616 1.232.11 Gross Plant Property Equipment Accumulated Depreciation Net Plant Property & Equipment Intes Other Asco TOTAL ASSETS 4 0 0 LIABILITIES Long Term Debt Deels One Year Accounts Payable Taxes Payable 125.064 21.056 111213 19.070 0 146.213 5.59 0 105 001 LIABILITIES Long Term Debte In One Year Accounts Payale Taxes Table 23.052 23.936 Sheet a B606 BALANCE SHEET (3 min) Tanes Payable Accrued Expenses Other Current Liabilities Total Current Liabilities 21.086 72.531 19.404 238 ORS 19.676 75.458 19.791 226,138 5.59 70222 54.71 277.255 0.019 66.542 44862 220.223 23.936 0 117.047 224 015 Taxes Payable Accrued Expenses Other Current Liabilities Total Current Liabilities TE Long Term Debt Deferred Taxes Other Liabilities TOTAL LIABILITIES 20775 244 25 506 195.741 72.967 122 31.575 343:18 92.399 4 66.876 44653 62.916 2.7 59.743 345 582 43.491 o 62 236 329,762 Long Term Dube Deferred Taxes Other Liabilities TOTAL LIABILITIES 10 1 3 EQUITY Common Stock Capital Surplus Retained Earnings Les Treasury Stock TOTAL EQUITY TOTAL LIABILITIES & EQUITY 0.671 255.214 641.358 269.91 627533 1,123 27 0.691 286.12 775.857 308.896 751772 1,096.95 0.696 305 309 923-713 41361 815917 12256.47 0.7 315404 938 58 412.536 842.148 1.117.73 0.705 327.742 986 523 412626 902344 1,232.11 EQUITY Common Stock Capital Surplus Retained Earnings Less Treasury Stock TOTAL EQUITY TOTAL LIABILITIES & EQUITY 51.913 522% 35 Coco Share Outstanding 53.00 53.919 51479 INCOME STATEMENT (5 millions, except per share) 2016 2017 2018 2019 2020 INCOME STATEMENT 2016 11 Sales Cost of Goods Sold Grons Profit 1.724.90 965.839 759.009 1882.06 1.00497 877.092 2.11256 1.06221 1050 15 1972.42 1,031.24 941.177 1.909.58 1.025.76 XXI 816 Sales Cost of Good Sold Grou Pront a A 00 OBY- Go BALANCE SHEET (5 million) A 11 11 Gross Protot Selling, General, & Administrative Exp Operating Income Before Deprec Depreciation, Depletion. & Amortizatio Operating Profit 759,009 531.839 227.17 61.874 165 296 877.092 591.767 285 125 6137 223.988 1,050.35 741.405 308.948 80.296 228.652 941.177 757.673 181104 90.665 93.439 883816 732.722 151.094 86.09 65.004 Gross Profile Selling General, & Administrative Exp. Operating Income Before Deprec. Depreciation, Deption, & Amortiration Operating Prote 14 Interest Expense Non-Operating Income/Expense Special Hems Trytax Income Total Income Taxes Income before Extraordinary Items & Discontinued Operations Savings Dav to Common Stock Equiv. Adjusted Net Income 5.888 1.28 0 162.688 56789 9.216 9.786 0 224.508 75.933 5.046 5.987 0 229.593 82.552 43 2.592 296 88.763 29.019 0332 0 3.2 67.872 22,164 Interest Expense Non-Operating locore.Expense Special Rem Pretax Income Total Income Taxes Income before Extraordinary Item & Discontinued Operation Saving Due to Common Stock Ful Adjusted Net nome 103903 0 101.90 148.575 0 14.575 147.041 0 147041 58844 . 58844 45.SOR -0.834 44.64 Comments on the common.stre statements 1. Leverage and Liquidity Ratio Assets to quity Debt to asses Detto equily Tones interesteamed Current ratio Acides 7 Time- 12 BISA 4. - 1001 - $ 000123- BALANCE SHEET(5 milions) I... 60 DBY- . MEN'S WEARHOUSE INC. BALANCE SHEET (5 millions) 2016 2017 2018 2019 2020 ASSETS Cash & Short-Term Investments Net Receivables Inventories Prepaid Expenses Other Current Assets Total Current Assets Cross Plant Property Equipe Accumulated Dupreciation Net Plant, Property & Equipement Intangibles Other Assets TOTAL ASSETS 3 LIABILITIES Long Term Debt Dec Is One Year Accounts Payable Taxes Payable Accrued Expenses Other Current Liabilities Total Current Liabilities 1 Sheet - hew . BTA ..- .1... 00POY. 26.06 . BALANCE SHEET(Smiliona) 1 Total Current Liabilities M 29 0 11 Long Term Debt Deferred Taxes Other Liabilities TOTAL LIABILITIES EQUITY Common Stock Capital Surplus Retained Barings Les Treasury Stock TOTAL EQUITY TOTAL LIABILITIES & EQUITY 41 INCOME STATEMENT 5 millions, copper share) 2016 2013 2015 2019 2010 Sales Cost of Goods Sold Gross Profit Selling. General, & Administrative Exp Operating Income Refore Deprec Depreciation, Depletion. Amortization Sheett- 3 7 TN- 12 $0.99 123 BALANCE SHEETS) BIGA IV. 00 YE. B6 G6 . 0 Depreciation, Depletion, & Amortization Operating Profit Interest Expense Non-Operating Income Expense Specialis Pretax income Total Income Taxes Income Before Extraordinary Items & Discontinued Operations Savings Due to Common Stock Equiv. Adjusted Net Income Comments on the contestatements 1 Leverage and liquidity Ratio Arte equity De tout Dette equity Times interest earned Current ratio Acids Comment en leverage and Liquidity Ration Sheet E
