Need help with #2 and #4 in particular please :)
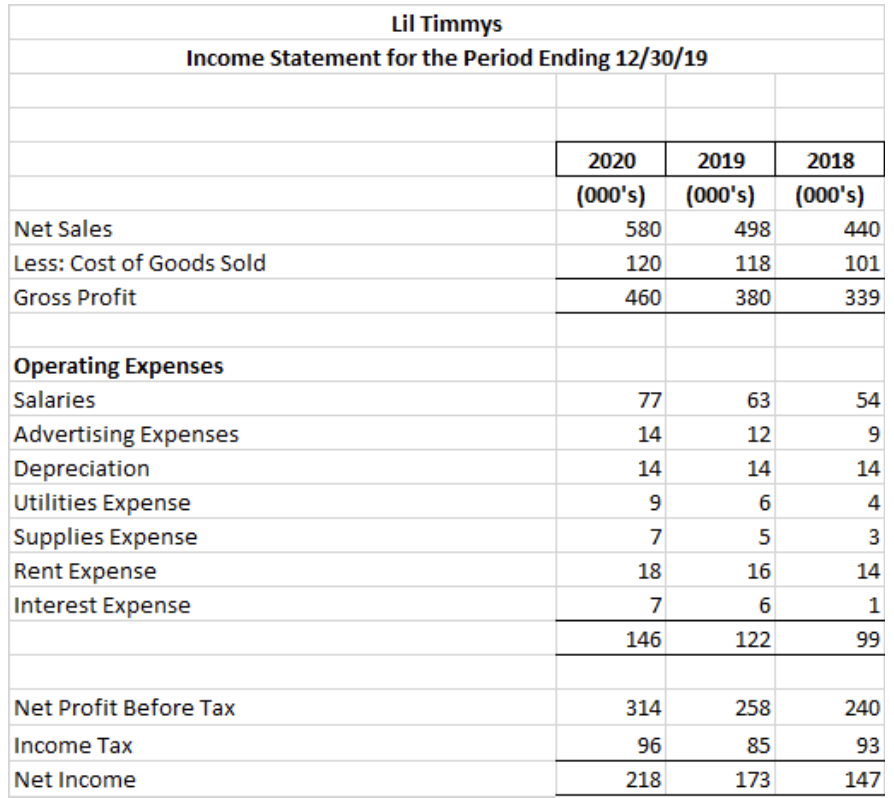
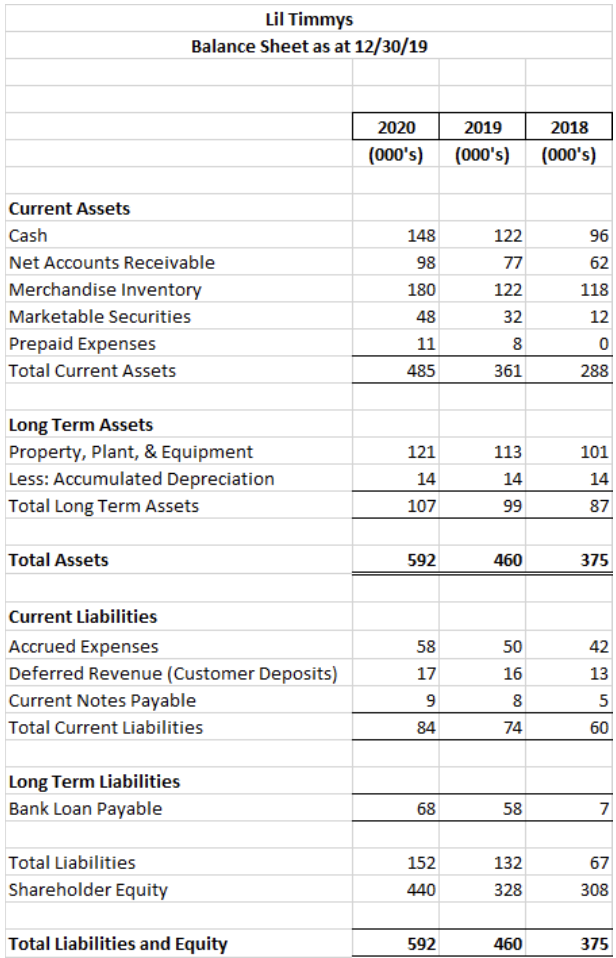
In the following case study, you will be analyzing the balance sheet and income statement of Lil' Timmy's Furniture Store. You will be hired as a consultant to evaluate their financial picture, liquidity, and appeal to potential buyers. Your goal is to learn to analyze income statements and balance sheets, and interpret different ratios and their implications on business. Lil' Timmy's Furniture Store is located in Reno, Nevada, and has been serving the local community since 1956. They offer leather sofas, custom bar stools, and one-of-a-kind coffee tables, all at an affordable price to their customers. However, due to the COVID-19 pandemic, their supply chain with China was cut to a halt; they were forced to temporarily close their retail store, and even after reopening, they are struggling to bring in customers. Unfortunately, Lil TImmy's owner has decided to list the business for sale, and larger retailer RC Willey is considering purchasing the business. Before they agree to a sale, RC Willey wants to learn more about Lil Timmy's financial picture, and has requested a few pieces of information. This case study will require you to analyze Lil' Timmy's balance sheet and income statement to help make a crucial business decision for RC Willey's acquisition team. RC Willey is relatively inexperienced when it comes to acquisitions; they want to hire you to be their financial consultant to help them interpret Lil Timmy's balance sheet and income statement. You will need to use financial data from 2019 and 2020 in Appendix A to answer the questions below; the goal of this exercise is to familiarize yourself with interpreting different ratios that come from the balance sheet and income statement. 1. Given Lil 'Timmy's balance sheet information, what insights can you make regarding their liquidity and ability to pay off their short term debt? (current ratio) 2. If RC Willey requires a 23% profit margin on its acquisitions, what advice do you have for the RC Willey acquisition team regarding Lil' Timmy's ratio? 3. What is Lil' TImmy's Asset Turnover Ratio? What does this say about their efficiency? 4. Should RC WIlley buy out Lil' Timmy's? Why or why not? Lil Timmys Income Statement for the Period Ending 12/30/19 \begin{tabular}{|l|r|r|r|} \hline & \multicolumn{1}{|c|}{2020} & \multicolumn{1}{c|}{2019} & \multicolumn{1}{c|}{2018} \\ \cline { 2 - 5 } & (000s) & (000s) & \multicolumn{1}{|l|}{ (000's) } \\ \hline Net Sales & 580 & 498 & 440 \\ \hline Less: Cost of Goods Sold & 120 & 118 & 101 \\ \hline Gross Profit & 460 & 380 & 339 \\ \hline & & & \\ \hline Operating Expenses & & & \\ \hline Salaries & 77 & 63 & 54 \\ \hline Advertising Expenses & 14 & 12 & 9 \\ \hline Depreciation & 14 & 14 & 14 \\ \hline Utilities Expense & 9 & 6 & 4 \\ \hline Supplies Expense & 7 & 5 & 3 \\ \hline Rent Expense & 18 & 16 & 14 \\ \hline Interest Expense & 7 & 6 & 1 \\ \hline & 146 & 122 & 99 \\ \hline & & & \\ \hline Net Profit Before Tax & 314 & 258 & 240 \\ \hline Income Tax & 96 & 85 & 93 \\ \hline Net Income & 218 & 173 & 147 \\ \hline \end{tabular} Lil Timmys Balance Sheet as at 12/30/19 \begin{tabular}{|c|c|c|} \hline 2020 & 2019 & 2018 \\ \hline(000s) & (000s) & (000 's) \\ \hline \end{tabular} Current Assets Cash Net Accounts Receivable Merchandise Inventory Marketable Securities Prepaid Expenses Total Current Assets \begin{tabular}{|r|r|r|} \hline 148 & 122 & 96 \\ \hline 98 & 77 & 62 \\ \hline 180 & 122 & 118 \\ \hline 48 & 32 & 12 \\ \hline 11 & 8 & 0 \\ \hline 485 & 361 & 288 \\ \hline \end{tabular} Long Term Assets Property, Plant, \& Equipment Less: Accumulated Depreciation Total Long Term Assets \begin{tabular}{|r|r|r|} \hline 121 & 113 & 101 \\ \hline 14 & 14 & 14 \\ \hline 107 & 99 & 87 \\ \hline \end{tabular} Total Assets \begin{tabular}{r|r|r} 592 & 460 & 375 \\ \hline \hline \end{tabular} Current Liabilities Accrued Expenses Deferred Revenue (Customer Deposits) Current Notes Payable Total Current Liabilities \begin{tabular}{|r|r|r|} \hline 58 & 50 & 42 \\ \hline 17 & 16 & 13 \\ \hline 9 & 8 & 5 \\ \hline 84 & 74 & 60 \\ \hline \end{tabular} Long Term Liabilities Bank Loan Payable Total Liabilities Shareholder Equity Total Liabilities and Equity \begin{tabular}{|r|r|r|} \hline 68 & 58 & 7 \\ \hline & & \\ \hline 152 & 132 & 67 \\ \hline 440 & 328 & 308 \\ \hline & & \\ \hline 592 & 460 & 375 \\ \hline \end{tabular}