

Question
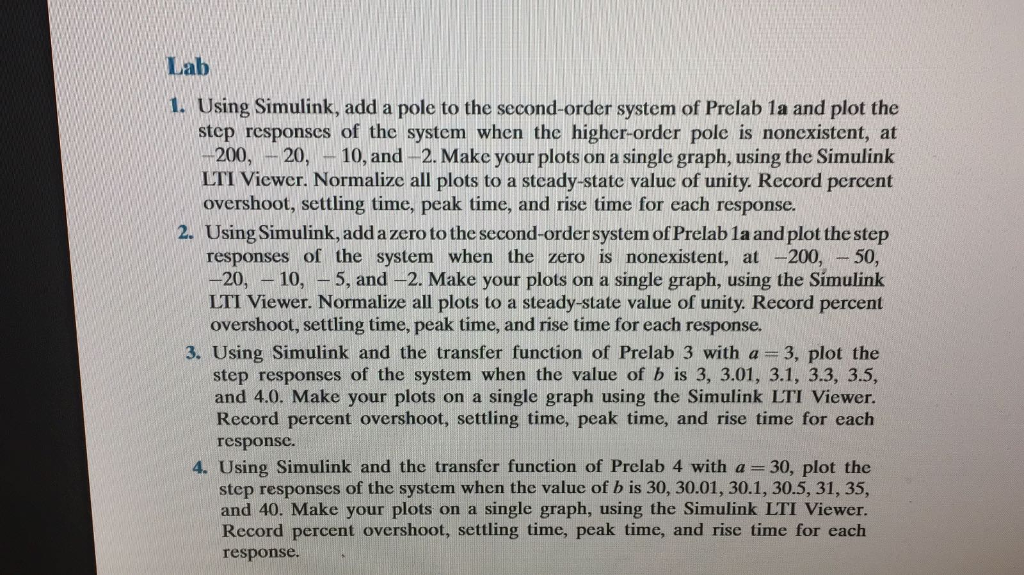
Need Help With 3 and 4 Q#3 Pre Lab Solutioin clear clc s=tf('s'); G1 = (25*(3.01/3)*(s+3))/((s+3.01)*(s^2+4*s+25)); step(G1) hold on G2 = (25*(3.1/3)*(s+3))/((s+3.1)*(s^2+4*s+25)); step(G2) G3 =
Need Help With 3 and 4
Q#3 Pre Lab Solutioin
clear clc s=tf('s'); G1 = (25*(3.01/3)*(s+3))/((s+3.01)*(s^2+4*s+25)); step(G1) hold on G2 = (25*(3.1/3)*(s+3))/((s+3.1)*(s^2+4*s+25)); step(G2) G3 = (25*(3.3/3)*(s+3))/((s+3.3)*(s^2+4*s+25)); step(G3) G4 = (25*(3.5/3)*(s+3))/((s+3.5)*(s^2+4*s+25)); step(G4) G5 = (25*(4/3)*(s+3))/((s+4)*(s^2+4*s+25)); step(G5) hold off
Q#4 Pre Lab
s=tf('s'); figure G1 = (2500*(3.01/3)*(s+3))/((s+3.01)*(s^2+4*s+2500)); step(G1) hold on G2 = (2500*(3.1/3)*(s+3))/((s+3.1)*(s^2+4*s+2500)); step(G2) G3 = (2500*(3.3/3)*(s+3))/((s+3.3)*(s^2+4*s+2500)); step(G3) G4 = (2500*(3.5/3)*(s+3))/((s+3.5)*(s^2+4*s+2500)); step(G4) G5 = (2500*(4/3)*(s+3))/((s+4)*(s^2+4*s+2500)); step(G5) hold off
Step by Step Solution
There are 3 Steps involved in it
Step: 1

Get Instant Access to Expert-Tailored Solutions
See step-by-step solutions with expert insights and AI powered tools for academic success
Step: 2

Step: 3
Ace Your Homework with AI
Get the answers you need in no time with our AI-driven, step-by-step assistance
Get Started
Database Publishing With Filemaker Pro On The Web
Authors: Maria Langer
1st Edition
0201696657, 978-0201696653