need help with 6-9
but in order to answer these questions you'll need ... this information.
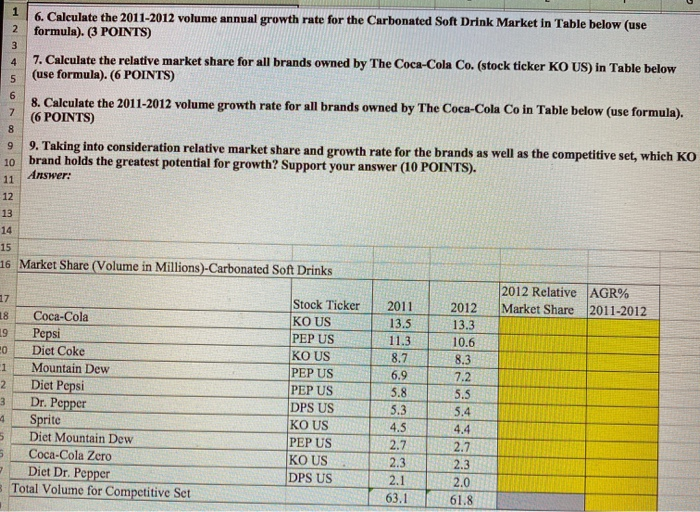
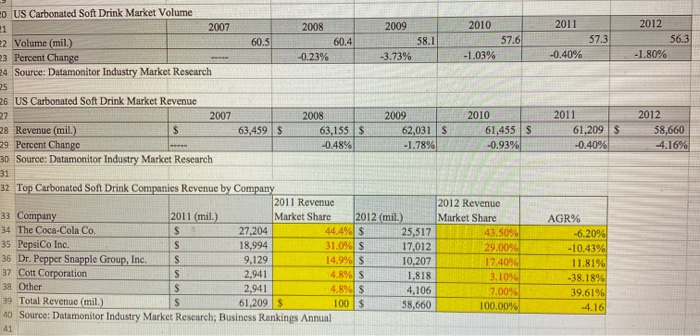
1 2 3 4 5 8 9 6. Calculate the 2011-2012 volume annual growth rate for the Carbonated Soft Drink Market in Table below (use formula). (3 POINTS) 7. Calculate the relative market share for all brands owned by The Coca-Cola Co. (stock ticker KO US) in Table below (use formula). (6 POINTS) 6 8. Calculate the 2011-2012 volume growth rate for all brands owned by The Coca-Cola Co in Table below (use formula). 7 (6 POINTS) 9. Taking into consideration relative market share and growth rate for the brands as well as the competitive set, which KO 10 brand holds the greatest potential for growth? Support your answer (10 POINTS). 11 Answer: 12 13 14 15 16 Market Share (Volume in Millions)-Carbonated Soft Drinks 2012 Relative AGR% 17 Stock Ticker 2011 2012 Market Share 2011-2012 18 Coca-Cola KO US 13.5 13.3 19 Pepsi PEP US 11.3 10.6 20 Dict Coke KO US 8.7 8.3 1 Mountain Dew PEP US 6.9 7.2 2 Diet Pepsi PEP US 5.8 5.5 Dr. Pepper DPS US 5.3 5.4 4 Sprite KO US 4.5 4.4 Diet Mountain Dew PEP US 2.7 2.7 Coca-Cola Zero KO US 2.3 Diet Dr. Pepper DPS US 2.1 2.0 Total Volume for Competitive Set 63.1 61.8 3 5 in 2.3 2011 2012 58.1 57.3 56.3 -0.40% -1.80% 2011 61,2095 -0.40% 2012 58,660 4.16% O US Carbonated Soft Drink Market Volume 31 2007 2008 2009 2010 2 Volume (mil.) 60.5 60.4 57.6 23 Percent Change -0.23% -3.73% -1.03% 24 Source: Datamonitor Industry Market Research 35 26 US Carbonated Soft Drink Market Revenue 27 2007 2008 2009 2010 28 Revenue (mil.) $ 63,459 $ 63,155 $ 62,031S 61,455 S 29 Percent Change -0.48% -1.78% -0.93% 30 Source: Datamonitor Industry Market Research 31 32 Top Carbonated Soft Drink Companies Revenue by Company 2011 Revenue 2012 Revenue 33 Company 2011 (mil.) Market Share 2012 (mil.) Market Share 34 The Coca-Cola Co. S 27.204 44.4% $ 25,517 43.50% 35 PepsiCo Inc. S 18,994 31.0% 5 17,012 29.00% 36 Dr. Pepper Snapple Group, Inc. s 9,129 14.9% $ 10,207 17.40% 37 Cott Corporation S 2,941 4.89 $ 1,818 3.10% 38 Other S 2,941 4.89 $ 4,106 7.00% 39 Total Revenue (mil.) s 61,2095 100$ 58,660 100.00% 40 Source: Datamonitor Industry Market Research; Business Rankings Annual 41 AGR% -6.20% -10.43% 11.81% -38.18% 39.61% -4.16


