Need help with figuring out if the measures from Prior Year/Industry: are Favorable, Unfavorable, or Same
Everything else is filled
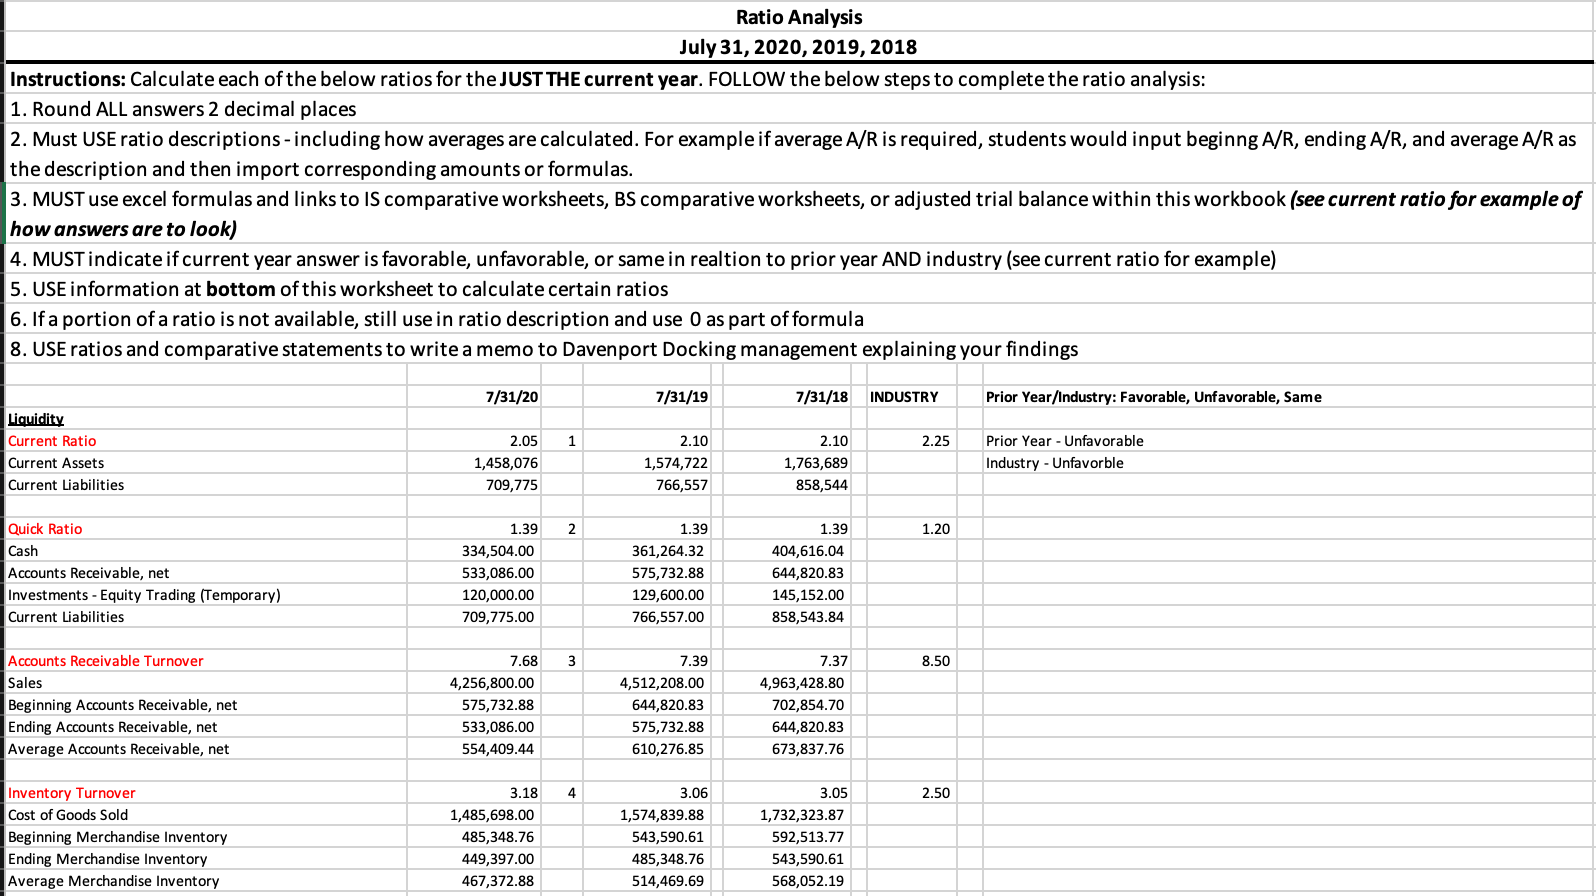
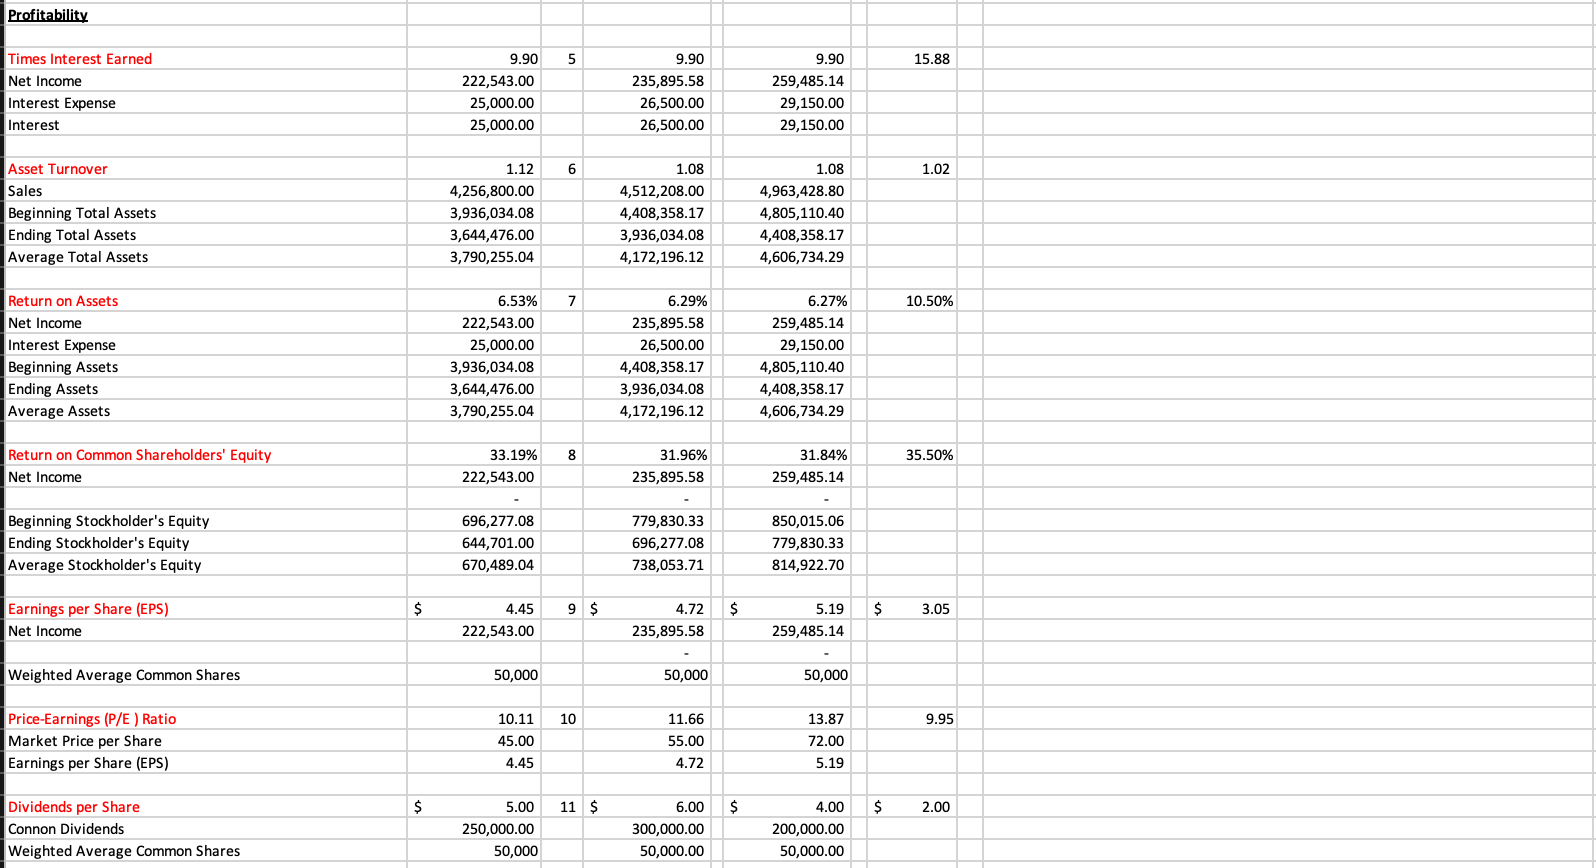

Ratio Analysis July 31, 2020, 2019, 2018 Instructions: Calculate each of the below ratios for the JUST THE current year. FOLLOW the below steps to complete the ratio analysis: 1. Round ALL answers 2 decimal places 2. Must USE ratio descriptions - including how averages are calculated. For example if average A/R is required, students would input beginng A/R, ending A/R, and average A/R as the description and then import corresponding amounts or formulas. 3. MUST use excel formulas and links to IS comparative worksheets, BS comparative worksheets, or adjusted trial balance within this workbook (see current ratio for example of how answers are to look) 4. MUST indicate if current year answer is favorable, unfavorable, or same in realtion to prior year AND industry (see current ratio for example) 5. USE information at bottom of this worksheet to calculate certain ratios 6. If a portion of a ratio is not available, still use in ratio description and use 0 as part of formula 8. USE ratios and comparative statements to write a memo to Davenport Docking management explaining your findings 7/31/20 7/31/19 7/31/18 INDUSTRY Prior Year/Industry: Favorable, Unfavorable, Same 1 2.25 Liquidity Current Ratio Current Assets Current Liabilities 2.05 1,458,076 709,775 2.10 1,574,722 766,557 2.10 1,763,689 858,544 Prior Year - Unfavorable Industry - Unfavorble 2 1.20 Quick Ratio Cash Accounts Receivable, net Investments - Equity Trading (Temporary) Current Liabilities 1.39 334,504.00 533,086.00 120,000.00 709,775.00 1.39 361,264.32 575,732.88 129,600.00 766,557.00 1.39 404,616.04 644,820.83 145,152.00 858,543.84 3 8.50 Accounts Receivable Turnover Sales Beginning Accounts Receivable, net Ending Accounts Receivable, net Average Accounts Receivable, net 7.68 4,256,800.00 575,732.88 533,086.00 554,409.44 7.39 4,512,208.00 644,820.83 575,732.88 610,276.85 7.37 4,963,428.80 702,854.70 644,820.83 673,837.76 4 2.50 Inventory Turnover Cost of Goods Sold Beginning Merchandise Inventory Ending Merchandise Inventory Average Merchandise Inventory 3.18 1,485,698.00 485,348.76 449,397.00 467,372.88 3.06 1,574,839.88 543,590.61 485,348.76 514,469.69 3.05 1,732,323.87 592,513.77 543,590.61 568,052.19 Profitability 5 15.88 Times Interest Earned Net Income Interest Expense Interest 9.90 222,543.00 25,000.00 25,000.00 9.90 235,895.58 26,500.00 26,500.00 9.90 259,485.14 29,150.00 29,150.00 6 1.02 Asset Turnover Sales Beginning Total Assets Ending Total Assets Average Total Assets 1.12 4,256,800.00 3,936,034.08 3,644,476.00 3,790,255.04 1.08 4,512,208.00 4,408,358.17 3,936,034.08 4,172,196.12 1.08 4,963,428.80 4,805, 110.40 4,408,358.17 4,606,734.29 7 10.50% Return on Assets Net Income Interest Expense Beginning Assets Ending Assets Average Assets 6.53% 222,543.00 25,000.00 3,936,034.08 3,644,476.00 3,790,255.04 6.29% 235,895.58 26,500.00 4,408,358.17 3,936,034.08 4,172,196.12 6.27% 259,485.14 29,150.00 4,805, 110.40 4,408,358.17 4,606,734.29 8 35.50% Return on Common Shareholders' Equity Net Income 33.19% 222,543.00 31.96% 235,895.58 31.84% 259,485.14 Beginning Stockholder's Equity Ending Stockholder's Equity Average Stockholder's Equity 696,277.08 644,701.00 670,489.04 779,830.33 696,277.08 738,053.71 850,015.06 779,830.33 814,922.70 $ 9 $ $ $ 3.05 Earnings per Share (EPS) Net Income 4.45 222,543.00 4.72 235,895.58 5.19 259,485.14 Weighted Average Common Shares 50,000 50,000 50,000 10 11.66 9.95 Price-Earnings (P/E) Ratio Market Price per Share Earnings per Share (EPS) 10.11 45.00 4.45 55.00 4.72 13.87 72.00 5.19 $ 11 $ $ $ 2.00 Dividends per Share Connon Dividends Weighted Average Common Shares 5.00 250,000.00 50,000 6.00 300,000.00 50,000.00 4.00 200,000.00 50,000.00 Solvency Ratios 12 0.80 Ratio of Liabilities to Stockholder's Equity Liabilities Stockholder's Equity 4.65 2,999,775 644,701 4.65 3,239,757 696,277 4.65 3,628,528 779,830