

Answered step by step
Verified Expert Solution
Question
1 Approved Answer
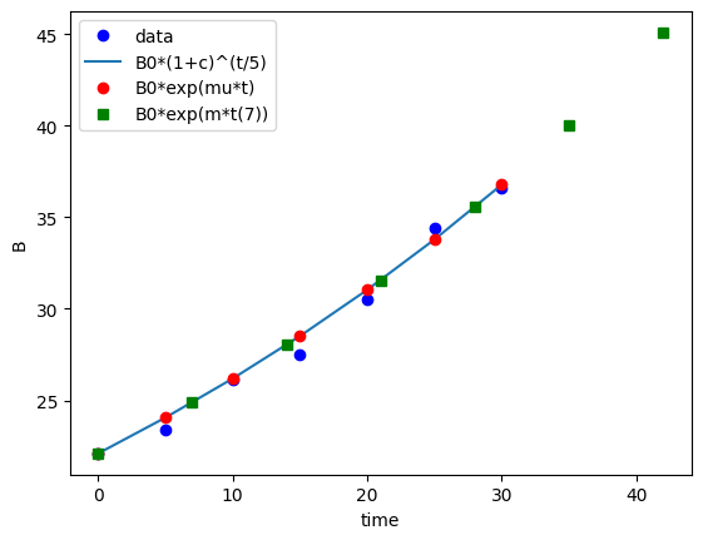
# Need help with fixing Python code to make output match with the corresponding graph from numpy import zeros, linspace import matplotlib.pyplot as plt from
# Need help with fixing Python code to make output match with the corresponding graph
from numpy import zeros, linspace
import matplotlib.pyplot as plt
from scipy import stats
import math
dt
Nt
B
dB zerosNt
Bexp zeros Nt
t linspace Nt Nt
tactual linspaceNtdt Nt
for i in range Nt:
dBi Bi Bi
copydB dB:Nt
copyB B:Nt
slope, intercept, rvalue, pvalue, stderr stats.linregress copyB copydB
tdouble math.logmathlogslopedt
mu math.logtdouble
Bexp B
for i in range Nt:
Bexpi B math.expmutactuali
pltfigure
pltplottactual, Bbo tactual, Bpowslopet tactual, Bexp, ro
pltlegenddataBctBexpmut loc "upper left"
pltxlabeltime
pltylabelB
dt
tactual linspaceNtdt Nt
Bexp zerosNt
Bexp B
for i in range Nt:
Bexpi Bexpi math.expmutactuali
pltplottactual, Bbo tactual, Bpowslopetr tactual Bmutactualgs
pltlegenddataBctBmutactual loc"upper left"
pltxlabeltime
pltylabelB
Step by Step Solution
There are 3 Steps involved in it
Step: 1

Get Instant Access to Expert-Tailored Solutions
See step-by-step solutions with expert insights and AI powered tools for academic success
Step: 2

Step: 3
Ace Your Homework with AI
Get the answers you need in no time with our AI-driven, step-by-step assistance
Get Started
Databases In Telecommunications Ii Vldb 2001 International Workshop Dbtel 2001 Rome Italy September 10 2001 Proceedings Lncs 2209
Authors: Willem Jonker
2001st Edition
354042623X, 978-3540426233